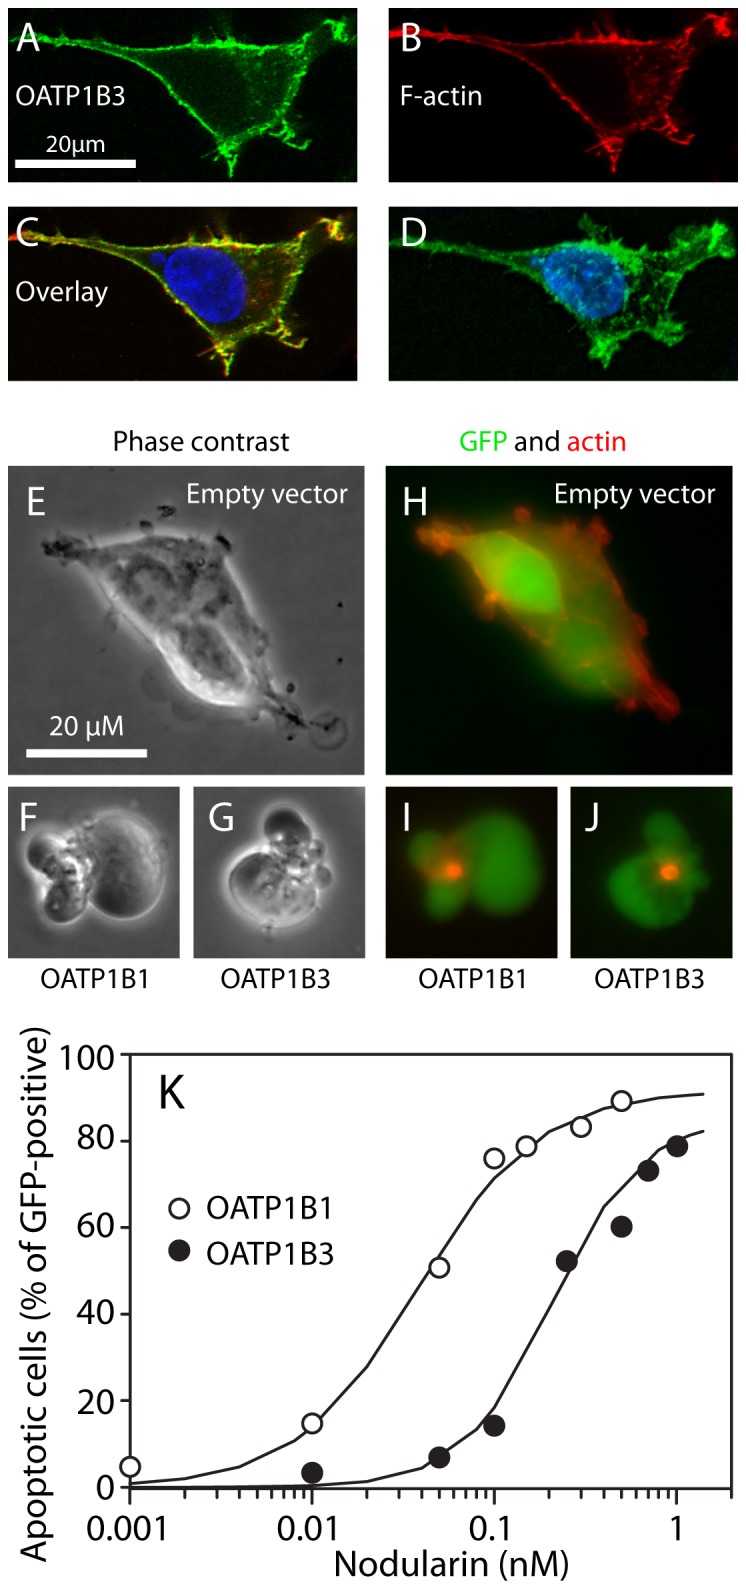
Figure 3. HEK-293T cells expressing OATP1B1/1B3 undergo apoptosis upon nodularin treatment.

A-D: Confocal micrographs of a HEK-293T cell with enforced expression of OATP1B3. Visualization of OATP1B3 stained green (A), F-actin stained red (B), and composite image (C) of OATP1B3 (green), F-actin (red) and nucleus (blue). D: 3D composite micrograph showing cell membrane localization of OATP1B3. E-J: Phase contrast and fluorescent micrographs of HEK-293T cells co-transfected with GFP and empty vector (E, H), OATP1B1 (F, I) or -1B3 (G, J) treated with nodularin. After nodularin exposure for 90 minutes, the OATP-expressing cells showed distinct polarized budding (F, G) with hypercondensed actin (I, J), whereas cells treated with empty vector remained unaffected (E, H). K: HEK-293T cells expressing OATP1B1 or -1B3, were treated with various concentrations of Nod for 90 min before assessment of apoptosis based on surface morphology (E–G). Only GFP-positive cells were counted.
