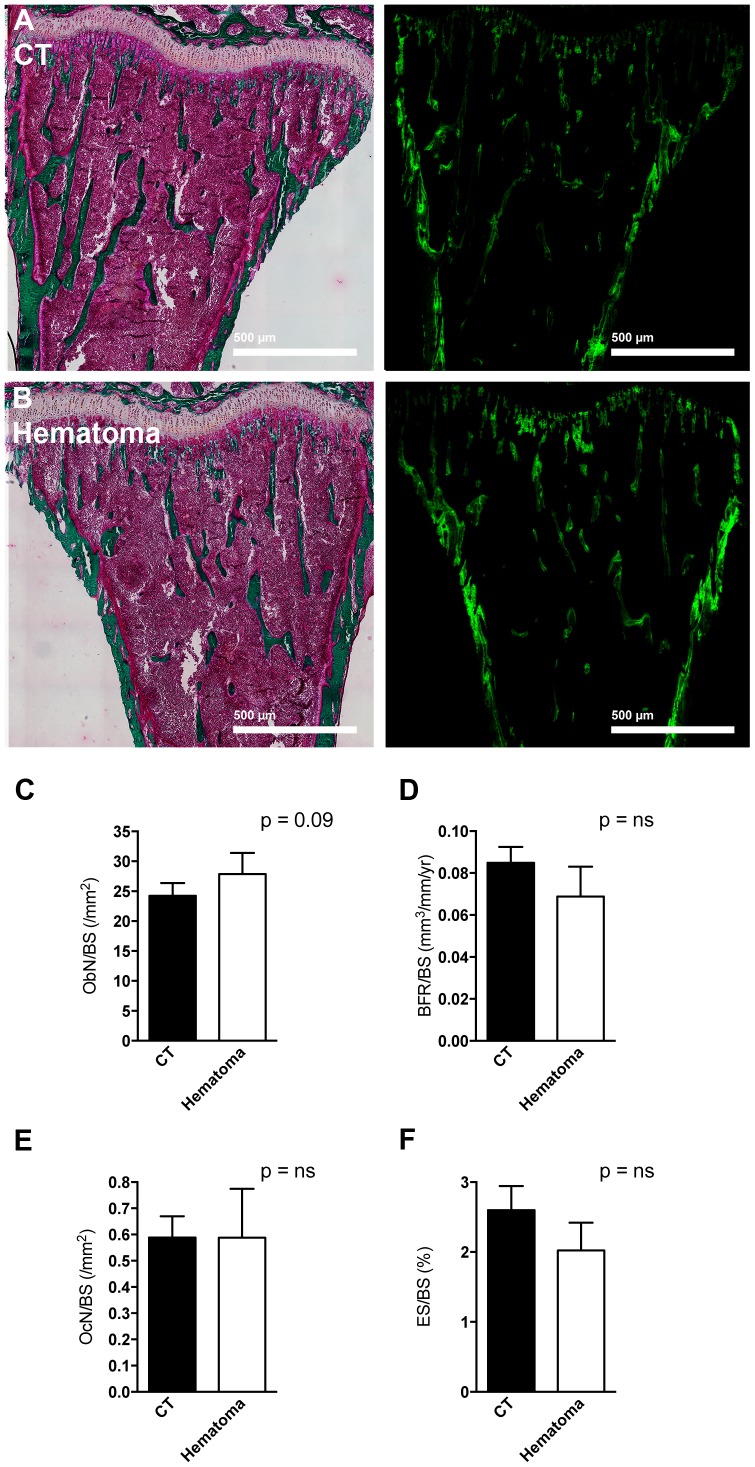
Figure 2. Bone histomorphometry after clot induction.
(A–B) After three days from the time of induction of a blood clot Masson-Goldner staining (on the left) and calcein labeling (on the right) showed no difference between control (CT) in panel A and hematoma induction in panel B in the same mouse. Neither osteoblast number (C), nor bone formation rate (D), nor osteoclast number (E), nor erosion surface (F) were different between the two tibiae. CT represents the right tibia without clot induction and hematoma represents the left tibia in which bone marrow was flushed and a blood clot was induced. Tibiae were obtained three days after clot induction in the left tibia, embedded in polymethylmethacrylate and stained using Masson-Goldner. n = 4 mice.

