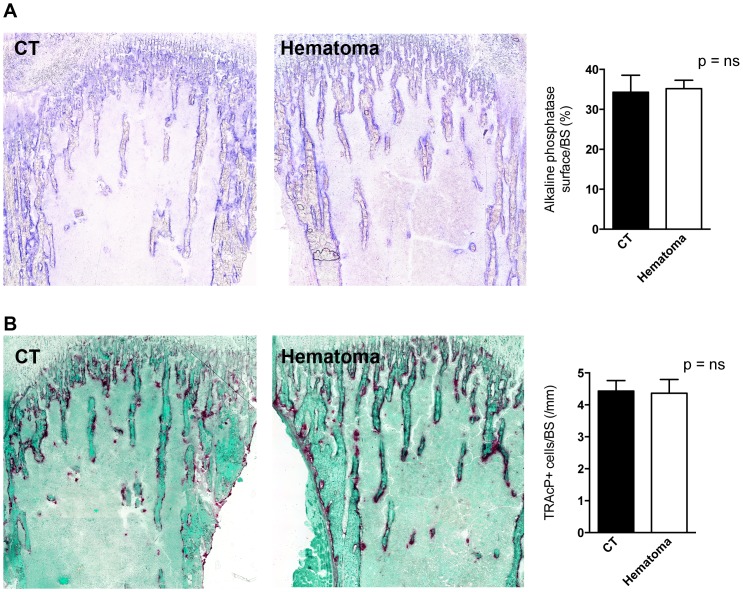
Figure 3. Enzymatic staining of bone sections.
(A) Osteoblast surface as evidenced by evaluating the surface stained positive for alkaline phosphatase did not differ between CT and hematoma bones. A representative stained pair of tibiae is shown on the left and quantification is shown on the right. (B) The number of osteoclasts as evidenced by counting the cells that stained positive for tartrate-resistant acid phosphatase and correcting to bone surface was not affected by clot induction. A representative stained pair of tibiae is shown on the left and quantification is shown on the right. CT represents the right tibia without clot induction and hematoma represents the left tibia in which bone marrow was flushed and a blood clot was induced. Tibiae were obtained three days after clot induction in the left tibia, fixed in 3,7% PFA, cryo-sectioned using adhesive film and stained as outlined in the methods. n = 4 mice.

