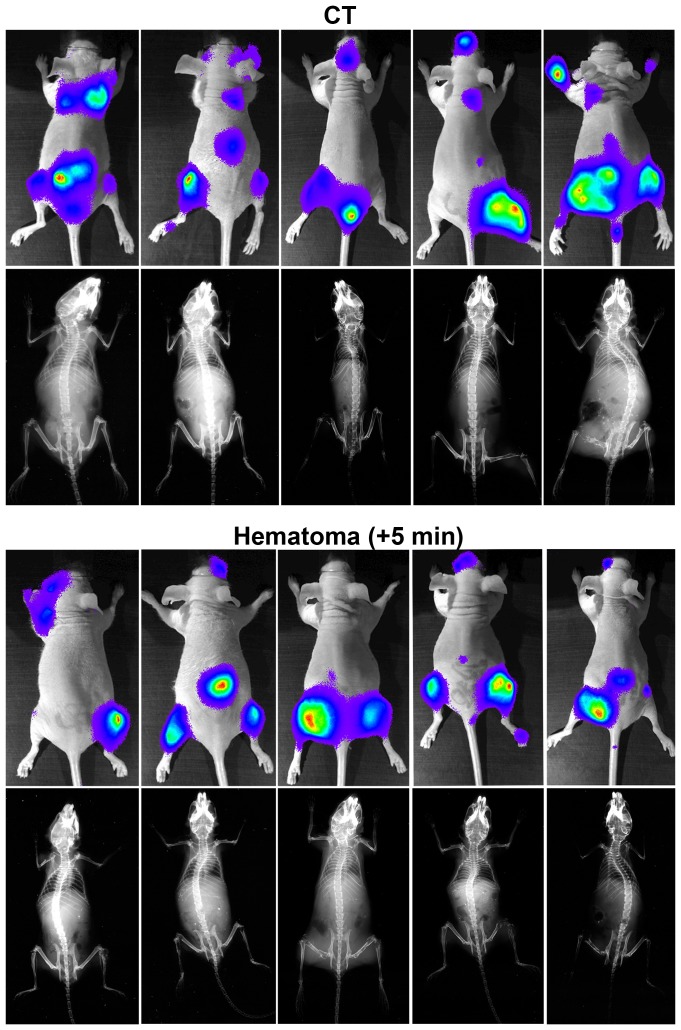
Figure 5. Bioluminescence and x-ray imaging in vivo.
Representative bioluminescence images from the last measurements before death and x-ray images at the time of death from 5 CT and 5 experimental mice in the group injected with cancer cells 5 minutes after clot induction. Upper panel represents the paired pictures from the CT group and the lower panel represents the paired pictures from the experimental group.

