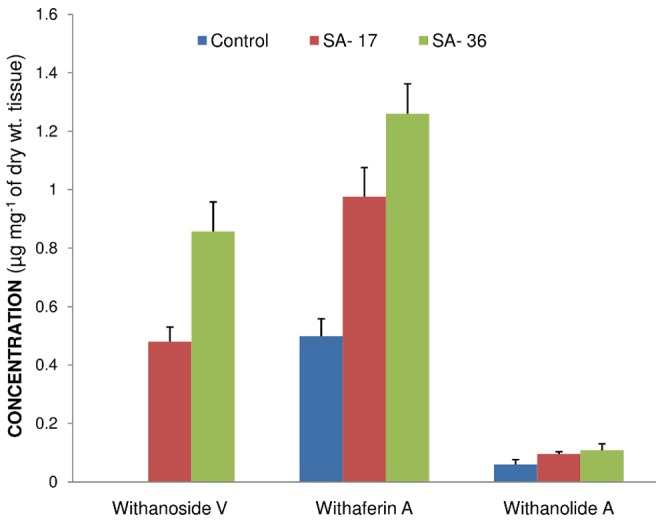
Figure 6. Quantitative variation in secondary metabolite content by exogenous application of salicylic acid.

Control = Metabolite content in water treated leaf tissues; SA-17 = Metabolite content in 17 hours post SA treated leaf tissues; SA-36 = Metabolite content in 36 hours post SA treated leaf tissues. Presence of withanoside V was not detected in water treated (control) leaf tissues.
