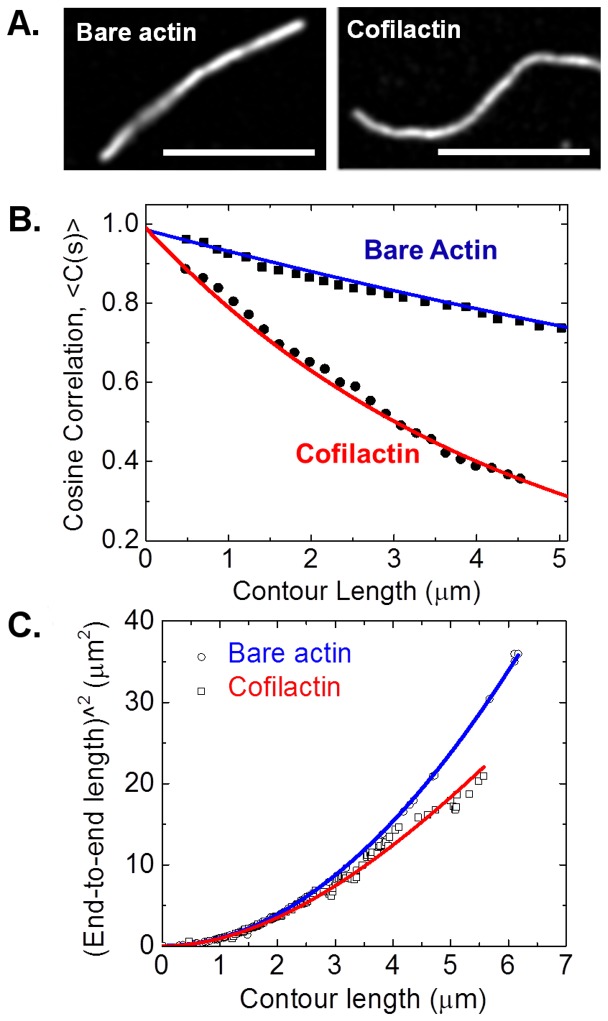
Figure 5. Determination of actin filament bending persistence lengths.
A. Representative fluorescence images of bare actin and cofilactin filaments. Cofilin binding density is >0.9. Scale bars are 5 µm. B. Cosine correlation data of bare actin (filled squares) and cofilactin filaments (filled circles) (N = 300 filaments). Solid lines represent best fits to equation 2 (cosine correlation) yielding Lp = 8.8±0.9 µm, Lp = 2.8±0.6 µm, for bare actin filaments and cofilactin filaments, respectively. C. End-to-end analysis data of bare and cofilactin filaments. Solid lines represent best fits to equation 3, Lp = 10.8±1.8 µm, Lp = 3.8±1.2 µm, for bare actin filaments and cofilactin filaments, respectively.

