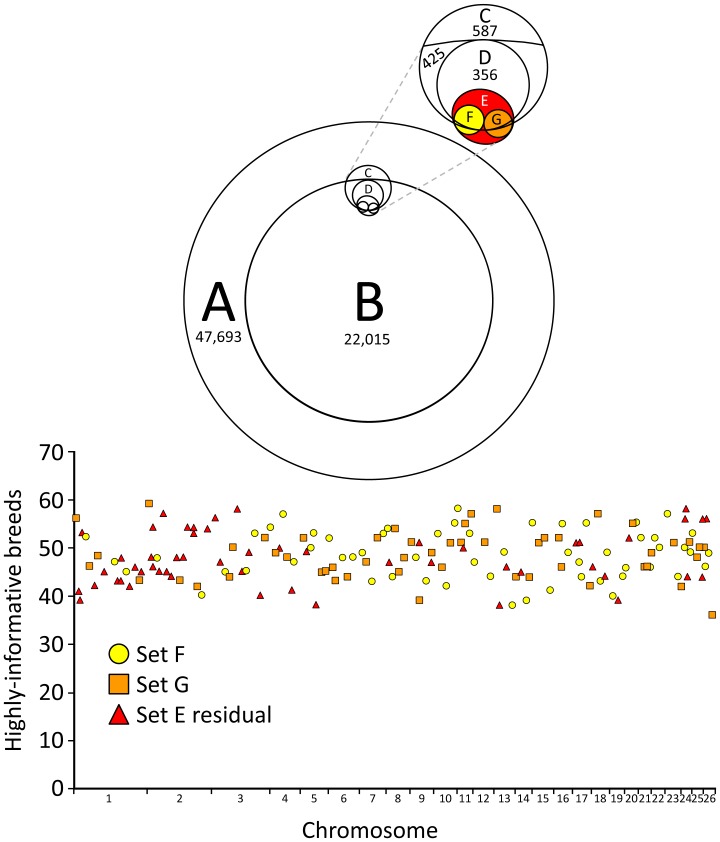
Figure 1. Venn diagram of SNP sets in this study and genome distribution of 163 parentage SNPs. Venn diagram:
Set A, autosomal SNPs from the Ovine SNP50k Bead Array; Set B, SNPs with a MAF greater than or equal to 0.3 in at least 36 of the 74 ISGC breed groups; Set C, SNPs from four preexisting ovine parentage SNP panels (425 inside set B); Set D, SNPs with MAF greater than or equal to 0.3 in a U.S. sheep panel; Set E, 163 USDA parentage SNPs from the present report with 42 outside Set C; Sets F and G, 57 and 52 USDA parentage SNPs used in two respective multiplex assays developed for use in North American sheep (12 and 17 SNPs outside Set C, respectively). Graph: distribution of 163 parentage SNPs across 26 autosomal chromosomes. A SNP was classified as highly-informative in a breed if the MAF was greater or equal to 0.3.

