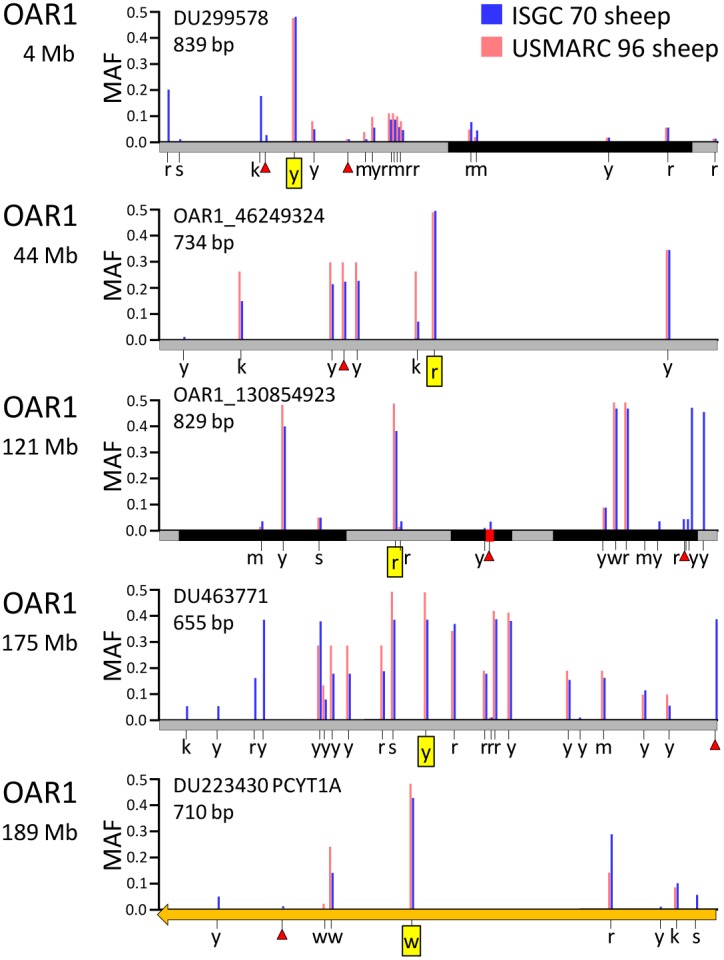
Figure 3. Physical maps of five representative amplicons with parentage SNPs.

High resolution map of five regions on ovine chromosome 1 that were targeted for in silico NGS analysis and PCR-amplification for Sanger sequencing and analysis. The parentage SNP is boxed in yellow. SNP positions are indicated by blue and red vertical bars and denote frequency of SNPs in an international panel of 70 sheep and a panel of 96 U.S. sheep, respectively and IUPAC/IUBMB ambiguity codes for nucleotides (r = a/g, y = c/t, m = a/c, k = g/t, s = c/g, w = a/t) [35]. Other symbols: red triangles, indel polymorphisms; black rectangles, repetitive elements grey rectangles, intergenic regions; orange arrows, exons.
