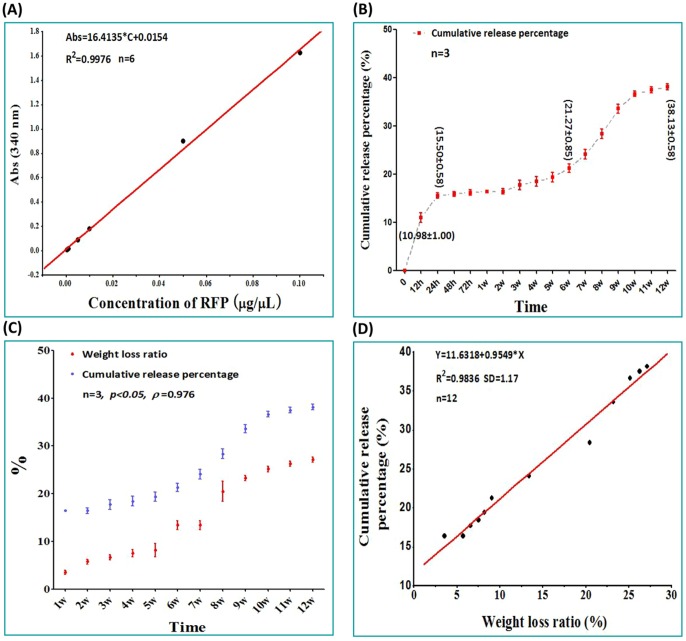
Figure 3. Drug release curve of RFP/PDLLA/nHA composite.
A: Standard curve of RFP in PBS. B: Drug release curve of RFP in PBS. C: The relationship between drug release and degradation. D. The curve of best fit of the weight loss ratio and cumulative release percentage. Each curve represents the mean ± standard deviation of 3 independent experiments performed in triplicate in B and C.

