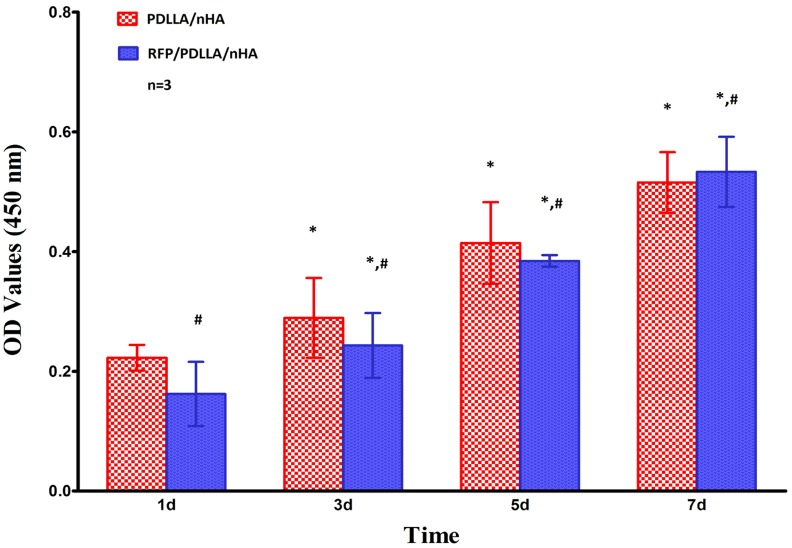
Figure 6. Proliferation of MC3T3-E1 cells.
Each bar represents the mean ± standard deviation of 3 independent experiments performed in triplicate. *, p<0.05 compared to the former testing time in the same group; #, no significant differences were found when compared with the PDLLA/nHA group by one-way ANOVA (p>0.05).

