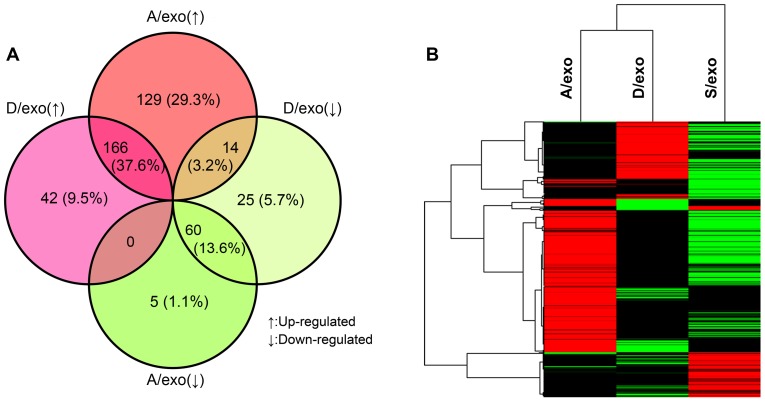
Figure 6. Profiling of exosomal RNA.
(A) The percentage distribution of the 441 differentially expressed miRNAs in A/exo and D/exo compared with S/exo. (B) Hierarchical cluster analysis of miRNA expression profiles in A/exo and D/exo compared with S/exo. Black color stands for a median transcript level. Red color indicates a transcript level above the median level, and green color represents a transcript level below the median level of the particular assay as measured in all samples.

