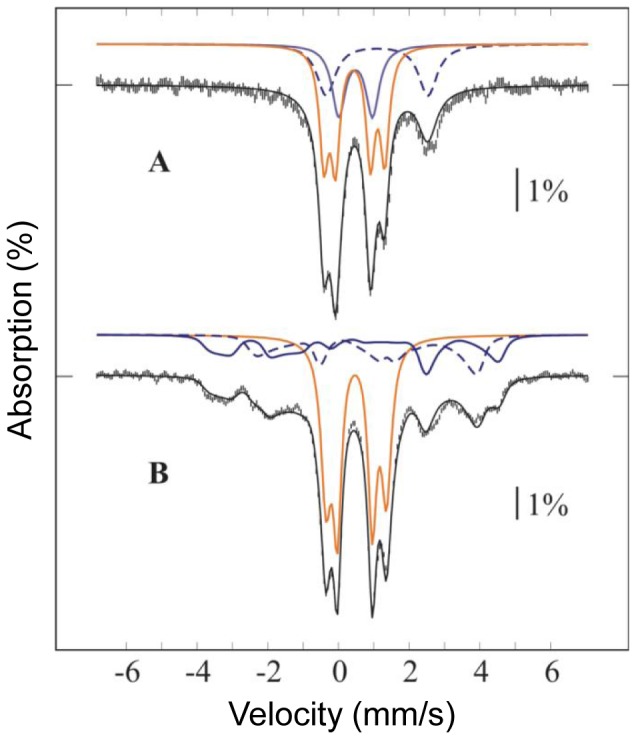
Figure 4. Mössbauer spectrum of the as-isolated E. coli RIC.

The spectrum was acquired at 4.2 K in a 600 G magnetic field applied perpendicular to the γ-rays (A) and at 154 K with no applied field (B). Vertical bars represent the experimental spectra, while the black solid line overlaid with the data represent the theoretical spectra. Contributions from mixed-valence (blue), and from diferric (orange) RIC are plotted above the experimental data. In the mixed-valence contribution, the trace originating from the FeIII is plotted as a blue solid line, whereas the trace from the FeII is plotted as a blue dotted line. The parameters used in the simulation are listed in Table 2, and the abundances of different iron sites in Table 3. The same abundances were used in the simulations of both spectra. For the mixed-valence form, the isomer shifts of the two iron sites obtained from fitting the 154 K spectrum were used into the spin-Hamiltonian simulation of the 4.2 K spectrum, after correction for second order Doppler shift (SODS). Quadrupole splittings were found to be substantially different and were fit separately. In contrast, the diferric component displays no temperature dependence of either isomer shifts (other than SODS) or quadrupole splittings, and displays slightly smaller line widths at higher temperature, indicating an isolated S = 0 ground state.
