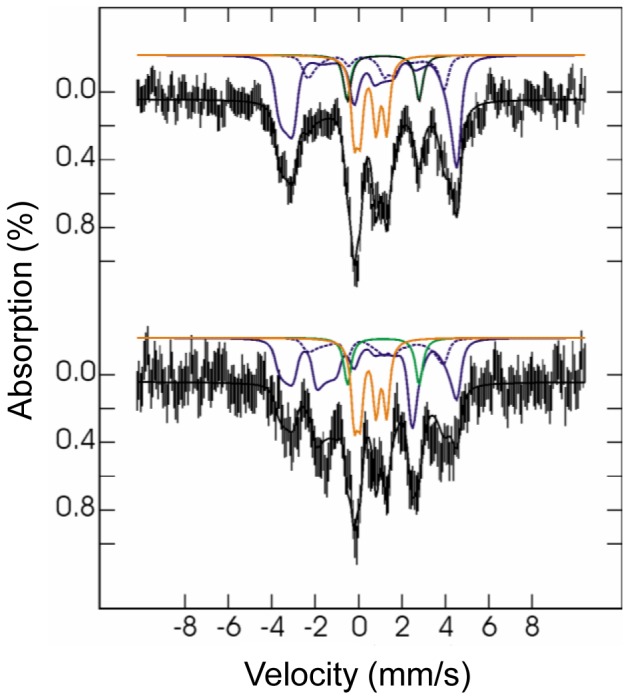
Figure 5. Mössbauer spectra of E. coli 56Fe-diiron RIC after incubation with 57Fe.

Spectra were measured at 4.2 K in a 600 G magnetic field applied parallel (top) or perpendicular (bottom) to the γ-rays. Vertical bars represent the experimental spectra while black solid lines represent the theoretical spectra. Contributions from mixed-valence (blue), diferric (orange) and ferrous species (green) are plotted above the experimental data. Contributions in percentage of total simulated intensity are 10% of ferrous, 24% of diferric, 51% of FeIII in mixed-valence centers (solid blue lines), and 15% of FeII in mixed-valence centers (dotted blue lines).
