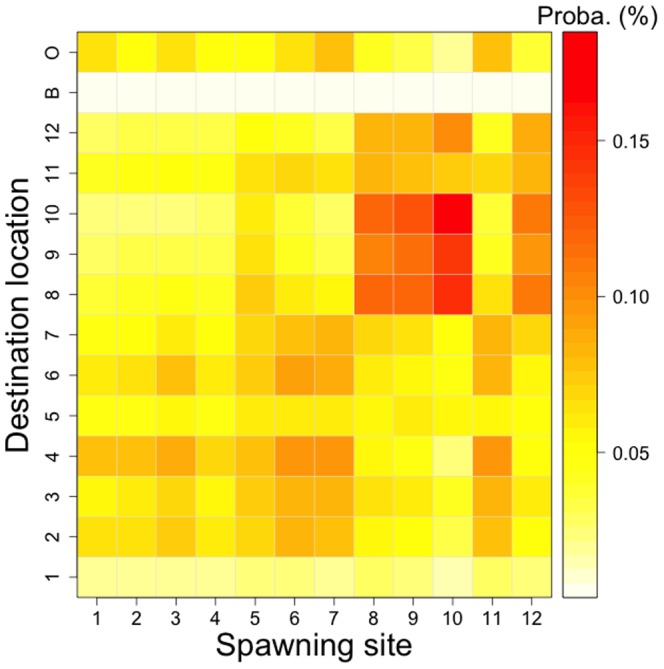
Figure 5. Potential connectivity matrix (i.e., probability).

This potential connectivity is an average of the 12 wind regimes scenarios. The potential connectivity is calculated as the ratio between the number of larvae in the destination location j after 20 days of dispersal, coming from the spawning site i, and the total number of larvae emitted in the spawning site i. In the destination locations, “B” represents the shallow waters and “O” the open ocean.
