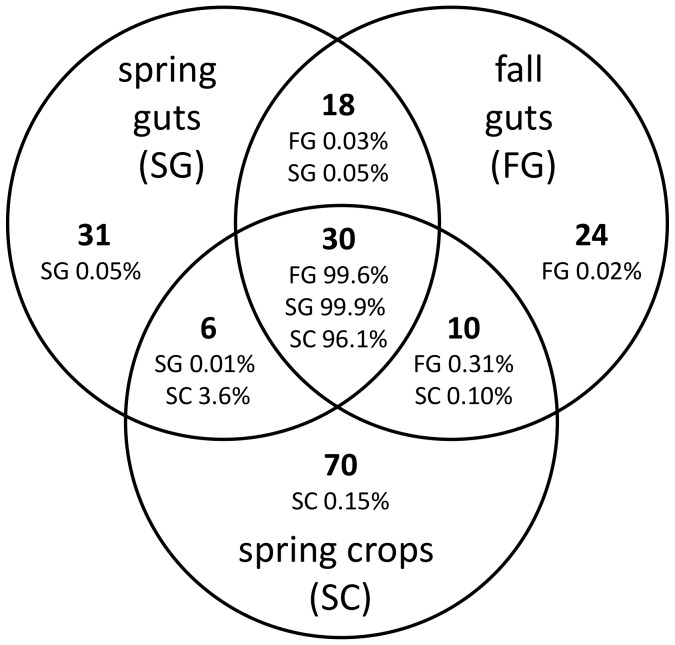
Figure 1. Bacterial taxa shared among the pyrosequencing libraries from the gut and crop samples.
Libraries were pooled by sample type (fall gut, spring gut, spring crop) and the number of OTU's (in bold) was defined based on ≥97% sequence similarity. The number of sequences in each of the gut and crop sample sets was calculated for each OTU and the percentage of sequences in each sample type that was either shared among sample sets or unique to a particular sample set was calculated. For example, the 70 OTU's unique to the spring crop samples account for only 0.15% of the total spring crop sequences, while the 30 OTU's shared among all sample sets includes 96.1% of all spring crop sequences.

