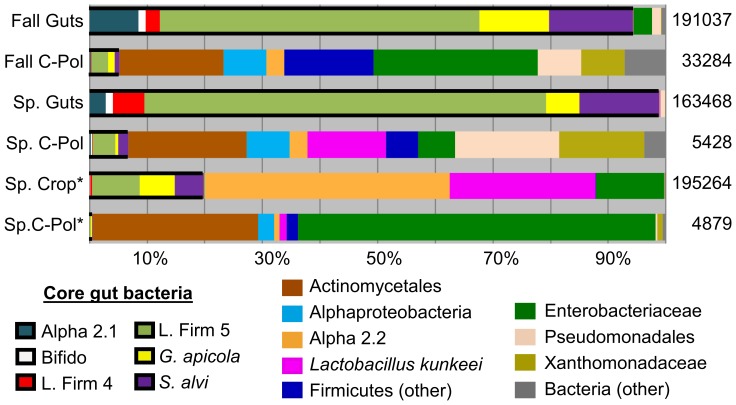
Figure 2. Relative abundances of bacterial groups from each sample type.
Libraries (individuals or colonies) were pooled by sample type and the number of sequences belonging to each taxon relative to the total number of sequences in that sample type was determined. Black boxes around portions of each bar denote core gut bacteria. Asterisks (*) denote pooled colony samples, and total reads post filtering are displayed to the right of each sample type.

