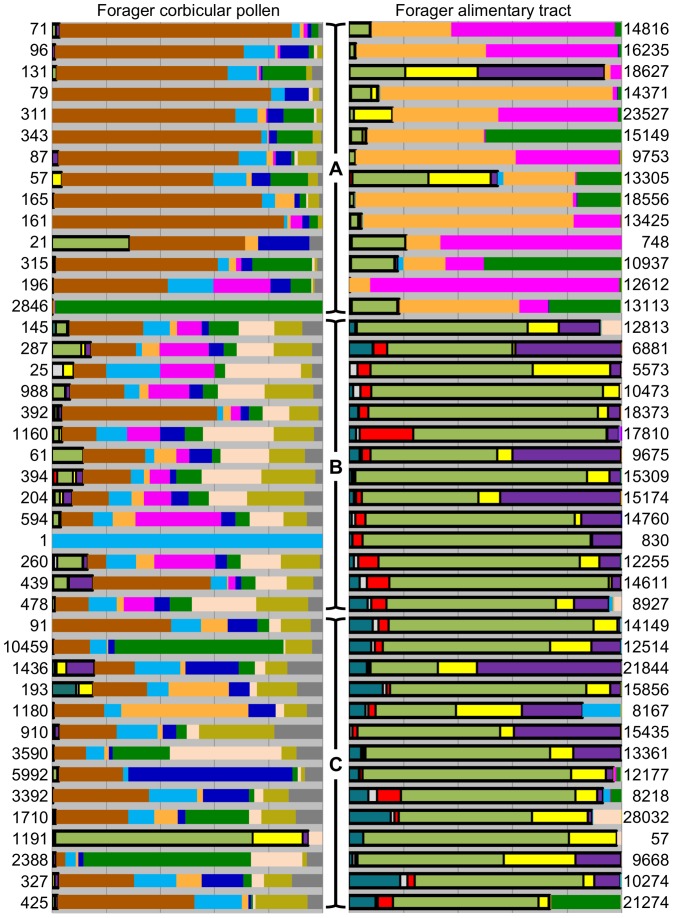
Figure 3. Relative abundances of bacterial groups within each individual library by sample type.
Color key is the same as figure 2. In the left column, corbicular pollen libraries were derived from the same bee(s) depicted in the adjacent alimentary tract column. Bars indicated by “A” each denote 10 pooled spring crops and associated corbicular pollen from 14 pooled colony samples; bars within “B” are 14 individual forager guts and their associated corbicular pollen sampled from a single colony in spring, and “C” is 14 individual forager guts and their associated pollen sampled from a single colony in fall. Black boxes around portions of each bar denote the core gut bacteria, and each bar represents a library flanked by its total read number.

