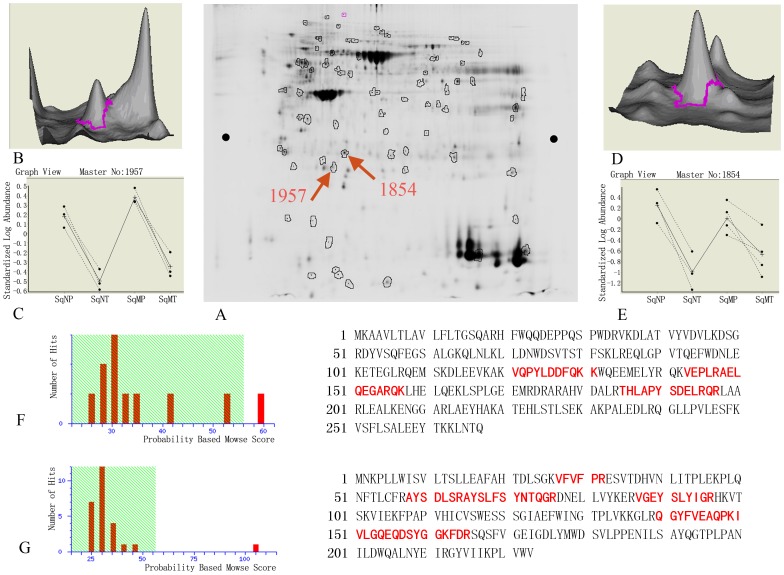
Figure 3. Detailed analyses of apoA1 and SAP by 2D-DIGE gel and MS.
(A) 2D-DIGE gel images for apoA1 and SAP were labeled as 1957 and 1854. pI and MW for spot 1957 are 5.0 and 30 KD; pI and MW for spot 1854 are 5.5 and 30 KD. (B) and (D): Protein waves for spots 1957 and 1854 in 3-D view show both are single peaks, which signifies high protein content. (C) Comparison of congruity of spot 1957 in tumor and benign tissues of non-metastasis group (SqN) and metastasis group (SqM) shows similar results. Compared to expression in SqNP, expression in SqNT was down-regulated 4.76-fold, P = 0.01; Compared to expression in SqMP, expression in SqMT was down-regulated 5.2-fold, P = 0.019. (E) Comparison of congruity of spot 1854 in tumor and benign tissues of non-metastasis group (SqN) and metastasis group (SqM) shows similar results. Compared to expression in SqNP, expression in SqNT was down-regulated 14.55-fold, P = 0.0025; comparing to SqMP, expression in SqMT was down-regulated 3.72-fold, P = 0.041. (F) The Mascot Score of spot 1957 confirmed by MALDI-TOF-MS was 59. After hydrolysis of apoA1, the matching rate of peptides with the database was 14%. The matched peptides are shown in red (G) The Mascot Score of spot 1957 confirmed by MALDI-TOF-MS was 105. After hydrolysis of SAP, the matching rate of peptides with the database was 27%. The matched peptides are shown in red.

