
Figure 8. Examples of the final series of tables output by the “Rosetta Tool”, showing details of the codons (triplets) and amino acids occurring at each position in the alignment.
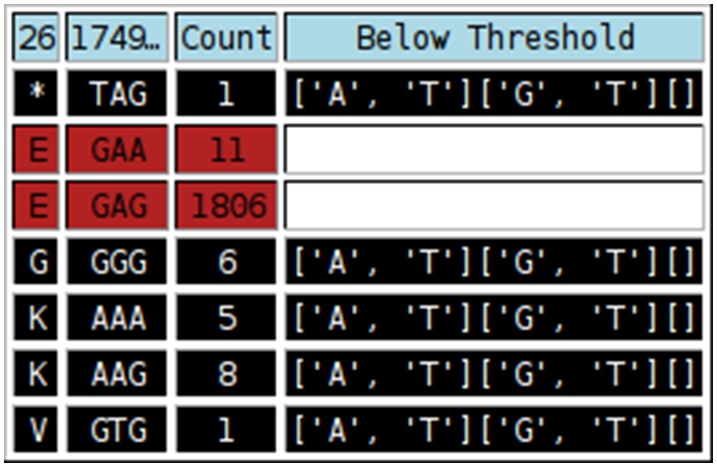
Cells with black backgrounds indicate where at least one nucleotide in the triplet occurred at below-threshold levels. These rows can be disregarded. The “Below Threshold” column lists the residues, for each position of the codon (indicated by the square brackets), which were below the. threshold.