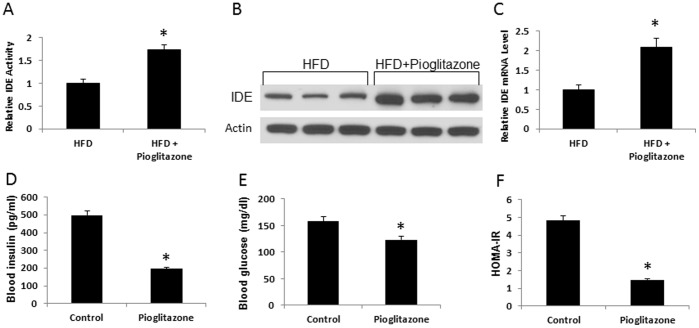
Figure 2. Regulation of liver IDE by pioglitazone.
A. IDE enzyme activity. Liver tissue was collected from DIO C57BL/6J mice were treated with pioglitazone (10 mg/kg/d) for last 2 months in 6 month HFD feeding. The samples were collected in fasting state. The IDE enzyme activity was determined (n = 10). B. IDE protein. The protein level was determined in Western blot. The experiment was performed three times with consistent results, and a representative blot is shown. C. IDE mRNA. mRNA level was determined in qRT-PCR (n = 5). D. Fasting blood insulin. E. Fasting blood glucose. F. HOMA-IR index (n = 10). *P<0.05 compared with the control.

