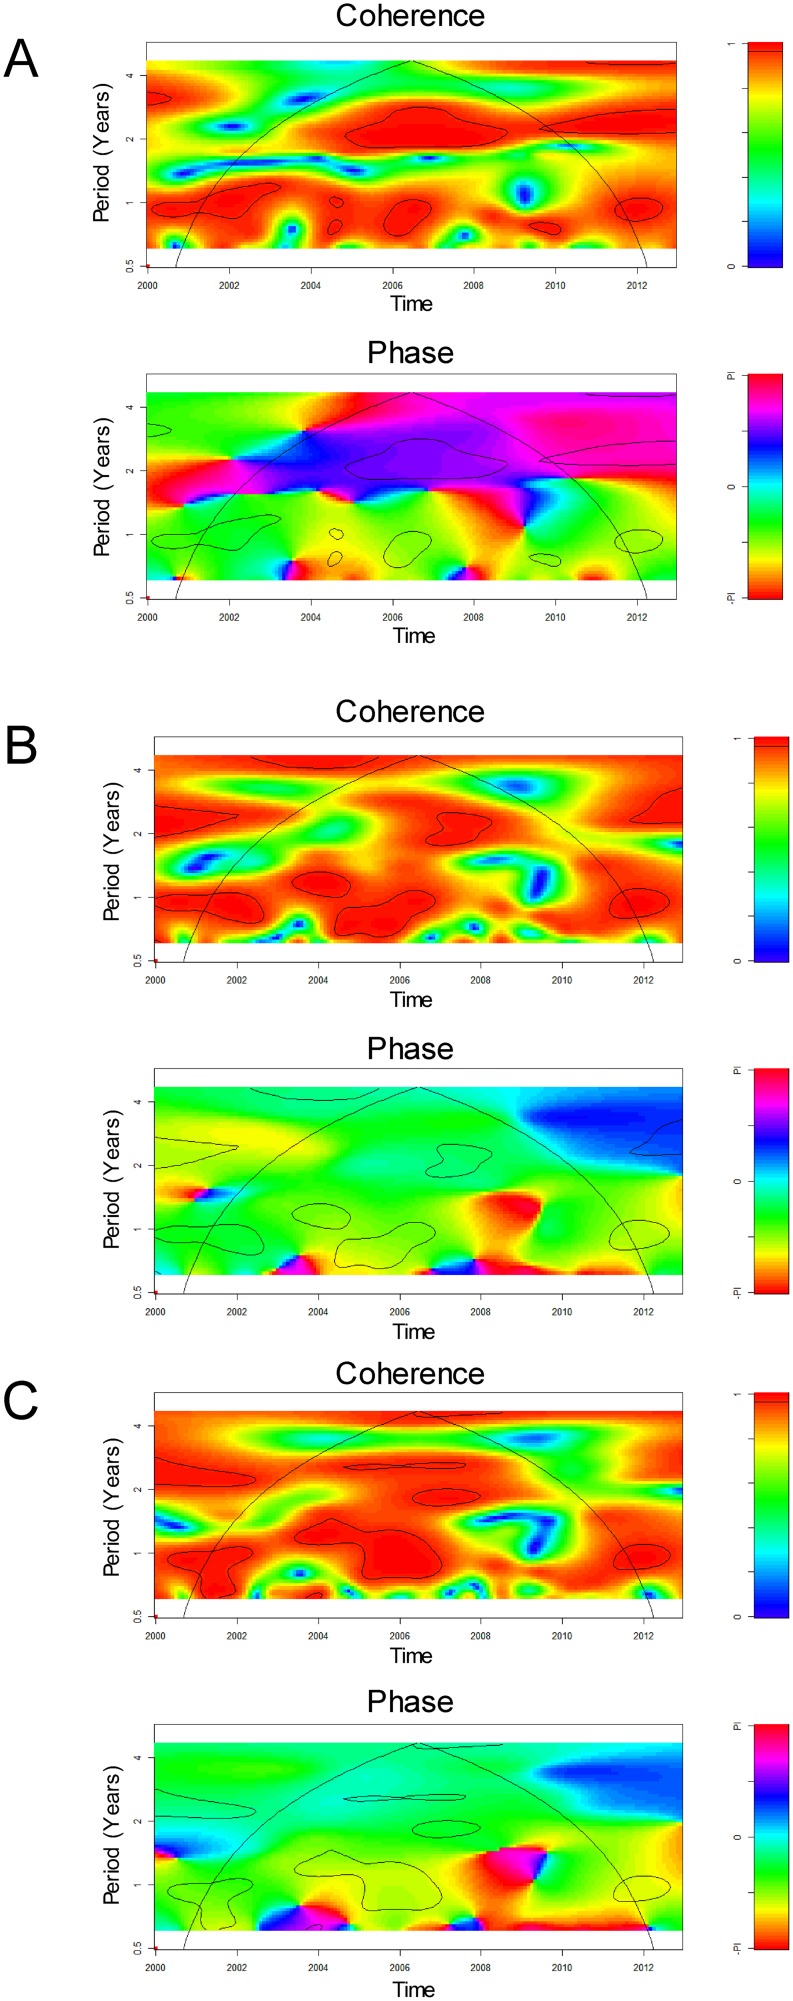
Figure 4. Cross-wavelet coherency and phase of the M. pneumoniae pneumonia time series with local weather indices.
(A) Temperature; (B) relative humidity; and (C) rainfall. Red regions in the upper part of the plots indicate frequencies and times for which the two series share variability. The cone of influence (within which results are not influenced by the edges of the data) and the significant coherent time-frequency regions (p<0.05) are indicated by solid lines. In cross-wavelet phase plots, colors correspond to different lags between variability in the two series for a given time and frequency, measured in angles from -PI to PI. A value of PI corresponds to a lag of 16 months.

