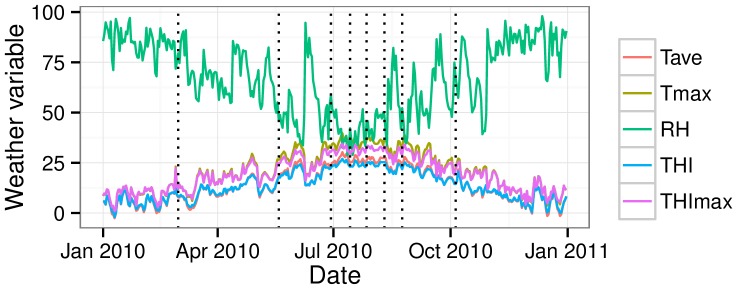
Figure 1. Trends of daily average (Tave, °C) and maximun (Tmax, °C) temperatures, relative humidity (RH, %) and average (THI) and maximum (THImax) temperature humidity index along the year 2010 (Data from SIAR http://crea.uclm.es/siar/datmeteo/).

Dotted lines are days of semen collection.
