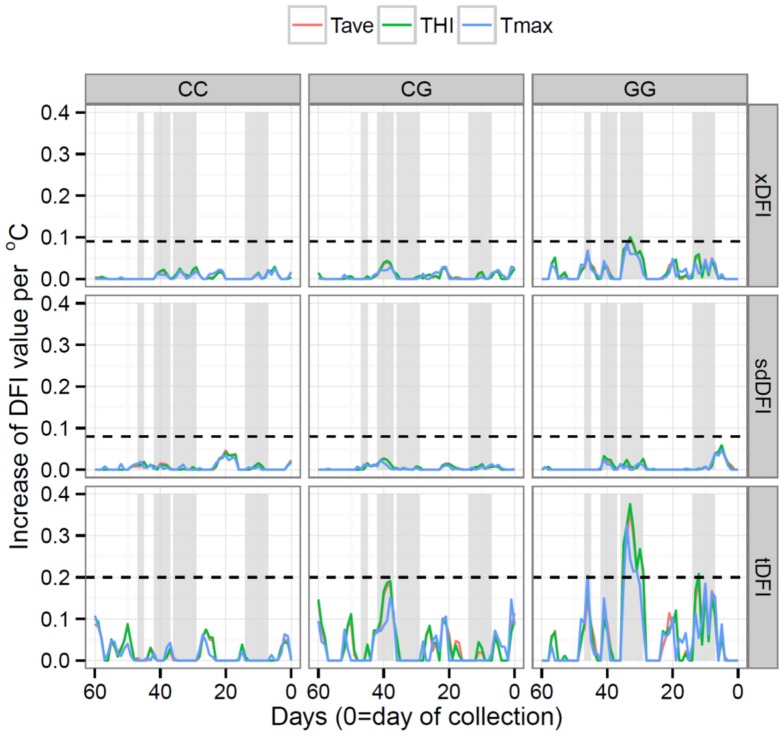
Figure 3. Ridge regression analyses relating DFI measures (xDFI, sdDFI and tDFI) from day 60 prior to semen collection to date of collection with weather measures (Tave = average daily temperature, Tmax = maximum daily temperature, and THI = temperature humidity index), for each HSP90AA1 genotype.
Fitted effects extending beyond dotted-lines (---) differ significantly (P<0.05) from zero. Four regions (gray regions) with a significant possible effect on sperm DFI levels were identified.

