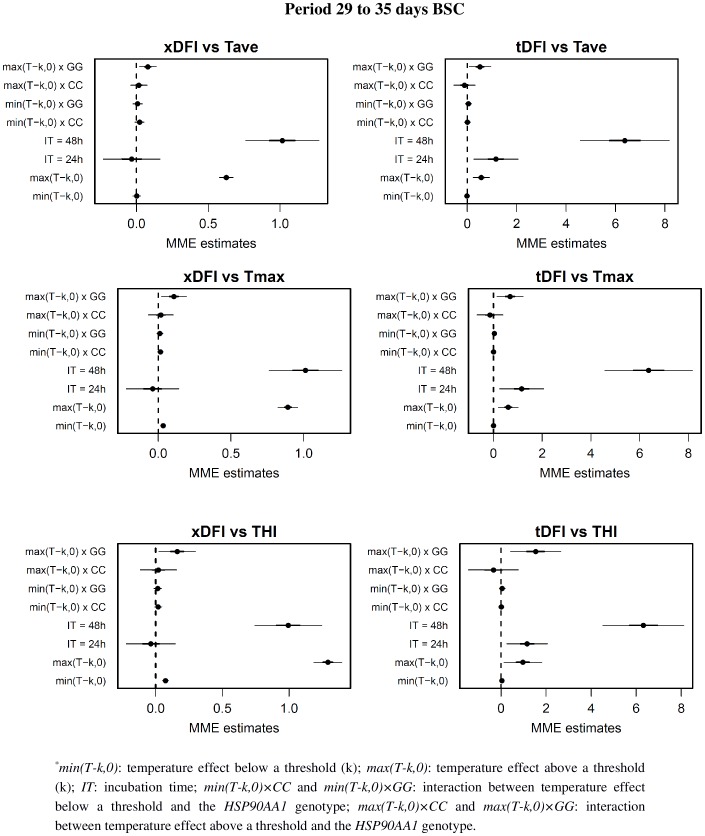
Figure 5. Regression coefficients from the mixed-effects model relating DFI values with summary measure of Tave, Tmax and THI for the days 29 to 35 before semen collection.
For each coefficient in the model, estimates (points) plus and minus 1 (bold line) and 2 (thin line) standard deviations are represented. *

