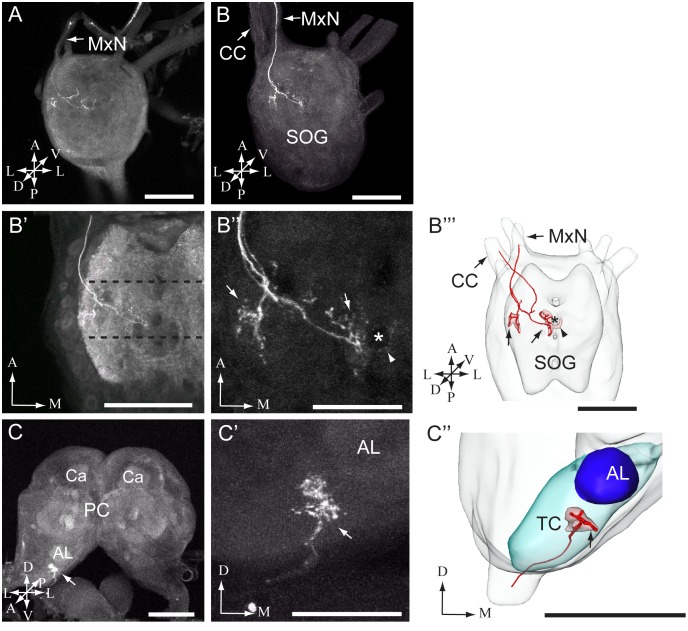
Figure 3. Images of the larval suboesophageal ganglion and brain with stained afferents originating from the medial sensillum.
(A, B) Confocal images from two preparations showing axon projections in the suboesophageal ganglion (SOG). In A, a preparation containing two labeled axon is presented, and in B, another preparation containing three stained fibers. As indicated by arrows in both images, the axons entered the SOG via the maxillary nerve (MxN). In B, the arrow to the left points to the circumoesophageal connective (CC). (B’-B’’) High resolution images of axon terminals in the SOG can be seen (same preparation as in B). In B’, the target region of the terminals, i.e. the maxillary neuromerebeing situated between the dotted lines is shown. In B’’, the detailed pattern of the axon terminals giving off processes in the ventro-lateral (left arrow) and the dorso-medial (right arrow) neuromere are shown. The arrowhead points to a few arborizations crossing the midline and the asterisk indicates a tract in the SOG, which was not stained by the synapsin antibody. (B’’’) 3D AMIRA-reconstruction of the SOG including target regions (indicated by red) of axons originating from the medial sensillum (arrows; made from the preparation shown in B-B’’). The stained axons in the MxN and the CC are indicated by single lines in the AMIRA model. (C-C’) Confocal images showing the axon terminals in the brain (same preparation as presented in B-B’’). In C, the arrow points to the innervated brain region, i.e. the tritocerebrum (TC). In C’, the stained axon terminals in the TC are shown in a closer view. (C’’) 3D AMIRA reconstruction of the TC including the target region (arrow) of the stained axons (made from the preparation presented in C-C’). The stained axons entering the TC are indicated by one single line in the AMIRA model. AL antennal lobe, Ca calyces, PC protocerebrum. A anterior, D dorsal, L lateral, M medial, P posterior, V ventral. Scale bars: 100 µm in A, B, B’, B’’’, C, and C’’; 50 µm in B’’ and C’.

