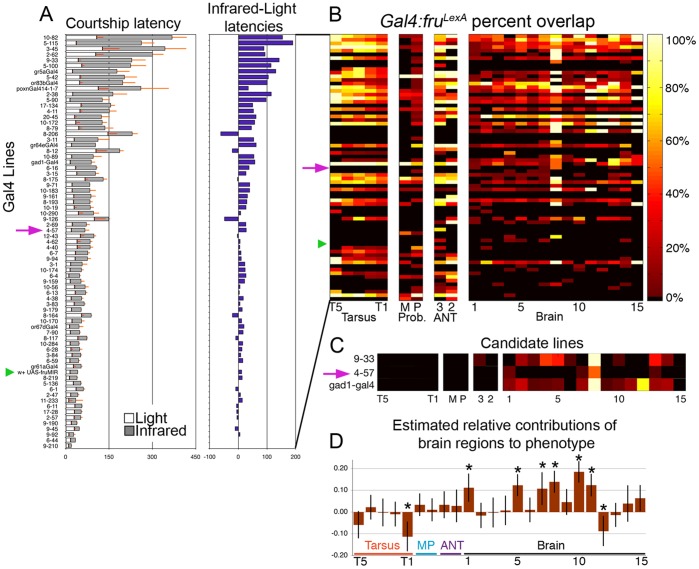
Figure 1. Mapping tissue-specific fruM repression to courtship latency phenotypes.
Courtship latencies of P[GawB] UAS-fruMIR latencies depicted as stacked bars. A) White bars represent latencies in ambient light, while dark gray bars represent latencies in infrared (n = 10–44 males per genotype). Purple bars indicate the difference between dark-light latencies. Green triangles indicate position of control UAS-fruMIR/+ line. Purple arrows indicate position of P[GawB]4-57 UAS-fruMIR. B) Colored heat map representing the percent of fruP1-LexA(+) neurons in a given hemisphere cluster or peripheral segment that also express Gal4. Rows are P[GawB] lines in the same respective order as panel A. Columns represent the fruP1-LexA(+) clusters in foreleg tarsal segments (T5-T1), maxillary palp (M), labellum (P), 3rd and 2nd antennal segments (3, 2), and brain clusters 1–15, nomenclature from 21. C) Three lines that exhibited no or little peripheral Gal4 expression and limited central overlap with fruP1-LexA. D) Estimated relative contributions of each fruM(+) cluster to delays in courtship latency in infrared; values are coefficients of a linear regression derived from partial least squares analysis (see Methods). Error bars represent 95% confidence intervals estimated by resampling.

