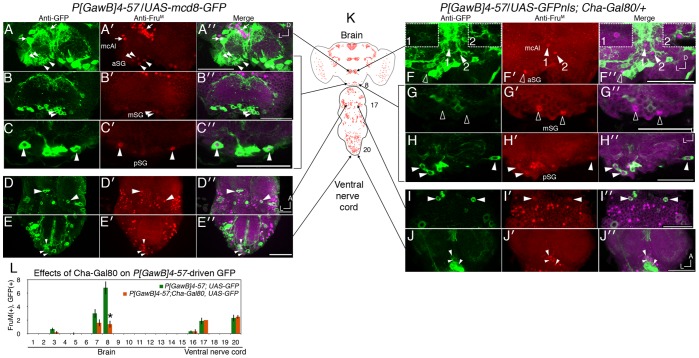
Figure 3. Cha-driven Gal80 inhibits P[GawB]4-57-driven Gal4 activity mainly in fruM SOG neurons.
A–E) Partial Z projections showing GFP expression in P[GawB]4-57/UAS-mCD8-GFP expression compared to F–J) GFP expression in the presence of ChaGal80/+. Panels show confocal images of anti-GFP, anti-FruM (panels marked by ′), and merged fluorescence (marked by ′′). A) Two GFP(+), FruM(+) were detected in the mcAl/DT6 cluster (arrows). Two to four smaller somas are found at 5–30 µm in depth, designated aSG (arrowheads). B) Two larger somas are found from 15–60 µm in depth, designated mSG. C) Two-three large somas are found at 60–100 µm in depth, designated pSG. D) Two GFP(+), FruM(+) somas are found near the prothoracic/metathoracic boundary of the ventral nerve cord. E) Three to four GFP(+), FruM(+) somas are located in the abdominal ganglion. F) The two mcAl/DT6 somas showed reduced, but detectable GFP expression. Insets show 2 µm Z-slices that highlight the mcAl/DT6 GFP(+), ChaGal80(+), FruM(+) cells. F–G) Cha-Gal80 repressed GFP fluorescence in all mSG neurons and a subset of aSG cells (hollow arroweads). Hollow arrowheads point to GFP(-), FruM(+) cells, indicative of Cha-Gal80 repression, while filled arrowheads point to GFP(+), FruM(+) cells. H–J) FruM(+) pSG and ventral nerve cord cells still expressed GFP. K) Locations of imaged regions are depicted on the diagram of the nervous system. L) Quantification of cells that express P[GawB]4-57-driven GFP in the presence and absence of Cha-Gal80, (n = 8, asterisk denotes p<.05). Scale bars = 50 µm.

