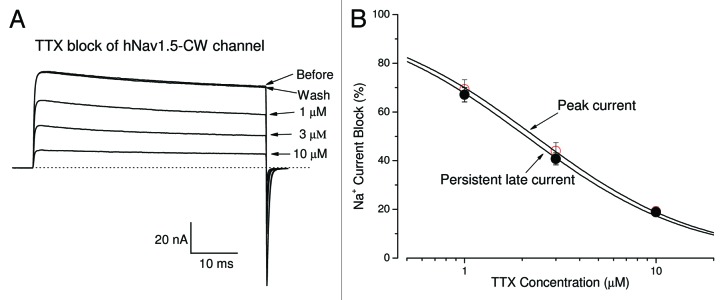
Figure 3. TTX blocks hNav1.5-CW Na+ channels. (A) Superimposed Na+ current traces were recorded in the absence and in the presence of TTX at 1, 3 and 10 μM. Currents were evoked by a 50-ms test pulse to +50 mV every 30 seconds. A steady-state block at each concentration was reached before application of the next solution. The block of Na+ currents by TTX could be completely reversed by the wash of the bath solution. (B) The dose-response curves were constructed using the data set as shown in (A). The peak or late Na+ currents were measured, normalized to the amplitude of the control, and plotted against the TTX concentration. Solid line represents a fit to the data with the Hill equation. The estimated IC50 values ± standard error [Hill coefficient ± S.E.] for peak-current block and the late-current block were 2.32 ± 0.02 μM (0.98 ± 0.01) (n = 6) and 2.07 ± 0.04 μM (0.94 ± 0.02) (n = 6), respectively.
