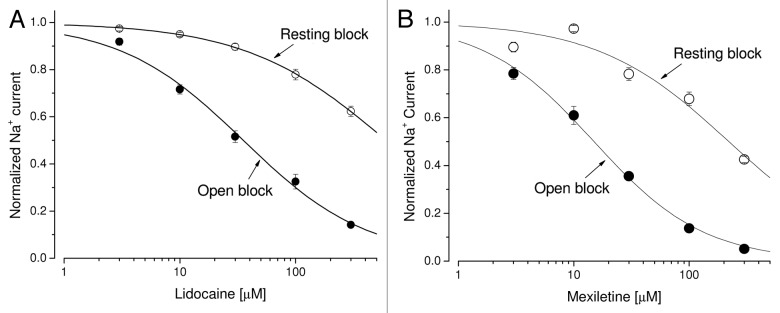
Figure 7. Dose-response curves for Class 1b antiarrhythmic drugs. (A) Dose-response curves for open-channel block and resting-channel block of lidocaine were constructed using the data set as shown in Figure 6A. For resting-channel block (open circles), the IC50 value (mean ± SEM) and the Hill coefficient (mean ± SEM) were estimated 606 ± 15 μM and 0.71 ± 0.01, respectively (n = 6), from the fitted curve. For open-channel block (filled circles), the IC50 value (mean ± SEM) and the Hill coefficient (mean ± SEM) were estimated 35.3 ± 2.7 µM and 0.82 ± 0.05, respectively (n = 6). (B) Dose-response curves for mexiletine were constructed as described before. For resting-channel block (open circles), the IC50 value (mean ± SEM) and the Hill coefficient (mean ± SEM) were estimated 220 ± 54 µM and 0.76 ± 0.16, respectively (n = 6). For open-channel block (filled circles), the IC50 value (mean ± SEM) and the Hill coefficient (mean ± SEM) were estimated 14.9 ± 0.9 μM and 0.90 ± 0.05, respectively (n = 6).
