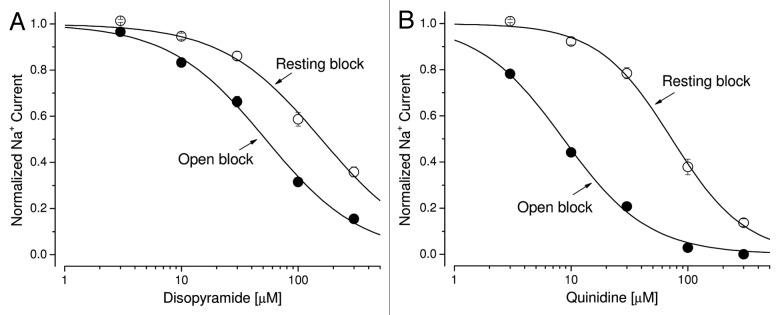
Figure 9. Dose-response curves for Class 1a antiarrhythmic drugs. (A) Dose-response curves for open-channel block and resting-channel block of disopyramide were constructed using the data set as shown in Figure 8A. For resting-channel block (open circles), the IC50 value (mean ± SEM) and the Hill coefficient (mean ± SEM) were estimated 158 ± 11 μM and 1.02 ± 0.08, respectively (n = 8). For open-channel block (filled circles), the IC50 value (mean ± SEM) and the Hill coefficient (mean ± SEM) were estimated 52.5 ± 2.8 µM and 1.05 ± 0.05, respectively (n = 8). (B) Dose-response curves for quinidine were constructed as described before. For resting-channel block (open circles), the IC50 value (mean ± SEM) and the Hill coefficient (mean ± SEM) were estimated 72.7 ± 2.9 μM and 1.38 ± 0.07, respectively (n = 8). For open-channel block (filled circles), the IC50 value (mean ± SEM) and the Hill coefficient (mean ± SEM) were estimated 8.6 ± 0.4 μM and 1.05 ± 0.05, respectively (n = 8).
