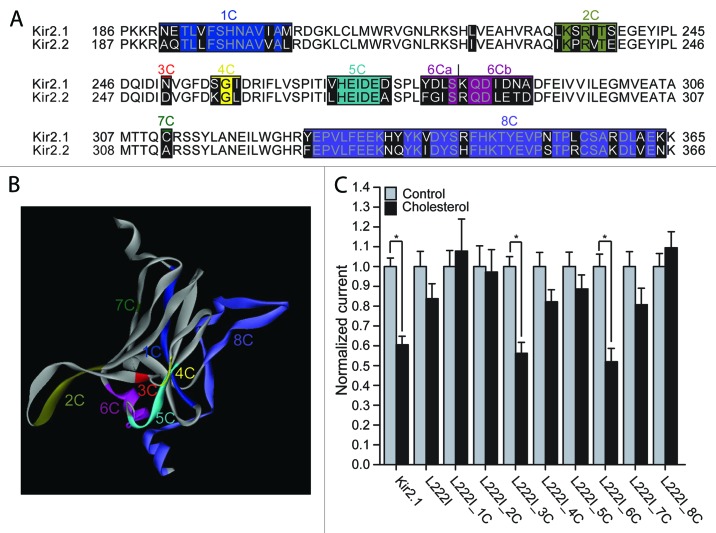
Figure 1. (A) Sequence alignment of the modeled C-terminus of Kir2.1 with the equivalent residues in Kir2.2. Highlighted in black on the sequence alignment are segments that include residues that differ between Kir2.1 and Kir2.2. (B) The C-terminus of one subunit of a model of Kir2.1 based on the cytosolic structure of Kir2.1 (PDB accession number 1U4F) and the TM domain of KirBac3.1 (PDB accession number 1XL4) showing segments 1–8 that correspond to the groups of residues in Figure 1A. The colors correspond to the colors in the alignment in Figure 1A. (C) Whole-cell basal currents at –80mV showing the effect of cholesterol enrichment on Kir2.1, on the L222I mutant and on each of the multiple mutants 1C-8C described in Figure 1A on the background of L222I to the corresponding segments in Kir2.2 (n = 12–43). Significant difference is indicated by an asterisk (*p < 0.05).

An official website of the United States government
Here's how you know
Official websites use .gov
A
.gov website belongs to an official
government organization in the United States.
Secure .gov websites use HTTPS
A lock (
) or https:// means you've safely
connected to the .gov website. Share sensitive
information only on official, secure websites.
