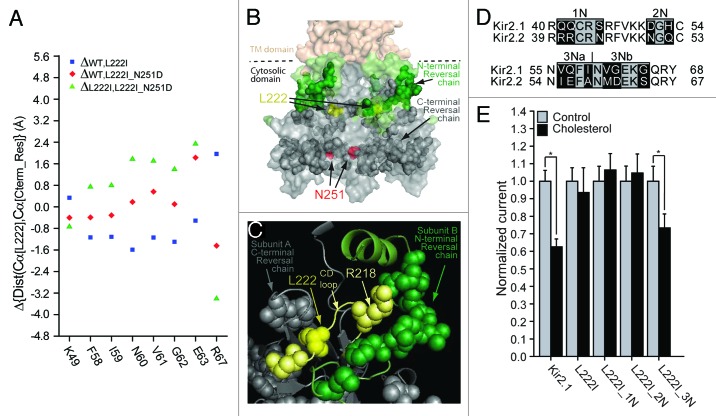
Figure 4. (A) N-terminal residues for which the direction of the changes in the distances relative to position 222 following the L222I mutation is reversed in L222I_N251D. The effect of the L222I mutation on the distances between the Cα atoms of position 222 and the Cα atoms of these residues with respect to the WT is depicted as blue squares whereas the effect of the L222I_N251D mutation compared with the L222I mutation is depicted by the green triangles. The effect of the L222I_N251D mutation compared with the WT channel is also shown as red diamonds. (B) Surface presentation of the cytosolic domain of Kir2.1 showing the N-terminal reversal residue chain (green), Also shown are the C-terminal reversal residue chain (dark gray), L222 (yellow), and N251 (red). (C) Model showing a Close-up of the residue reversal chain residues in the vicinity of L222 (yellow) of the CD loop. The CD loop is shown in light yellow. CD loop residues included in the reversal chain are shown in light yellow. Other C-terminal reversal chain residues in proximity of L222 are shown in dark gray. N-terminal reversal chain residues in the adjacent subunit are shown in green. (D) Sequence alignment of residues 40–68 located in the modeled N-terminus of Kir2.1 with the equivalent residues in Kir2.2 (39–67). Highlighted in black on the sequence alignment are segments that include residues that differ between Kir2.1 and Kir2.2. (E) Whole-cell basal currents recorded in Xenopus oocytes at –80mV showing the effect of cholesterol enrichment on Kir2.1, on the L222I mutant and on each of the multiple mutants 1N-3N that include mutations of the segments shown in Figure 4D on the background of L222I to the corresponding segments in Kir2.2 (n = 12–26). Significant difference is indicated by an asterisk (*p < 0.05).

An official website of the United States government
Here's how you know
Official websites use .gov
A
.gov website belongs to an official
government organization in the United States.
Secure .gov websites use HTTPS
A lock (
) or https:// means you've safely
connected to the .gov website. Share sensitive
information only on official, secure websites.
