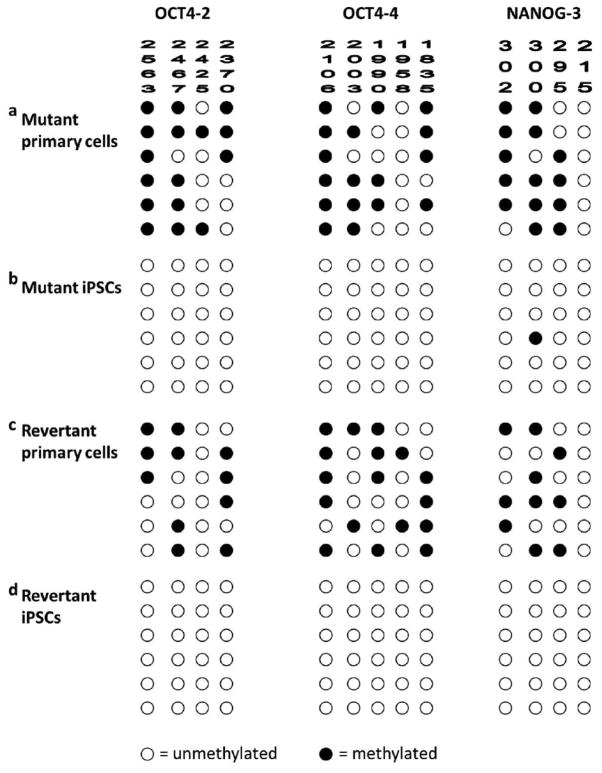
Figure 3. Epigenetic signature of RDEB iPSCs.
(a) A partially methylated pattern indicative of gene silencing of OCT4 and NANOG promoter sequences in mutant primary cells. (b) An unmethylated pattern in mutant iPSCs consistent with complete reprogramming into iPSCs. (c) A partially methylated pattern in revertant primary cells. (d) An unmethylated pattern in revertant iPSCs. Open circle indicates unmethylated site in the specified amplicon. Filled circle indicates methylated site in the same amplicon.

