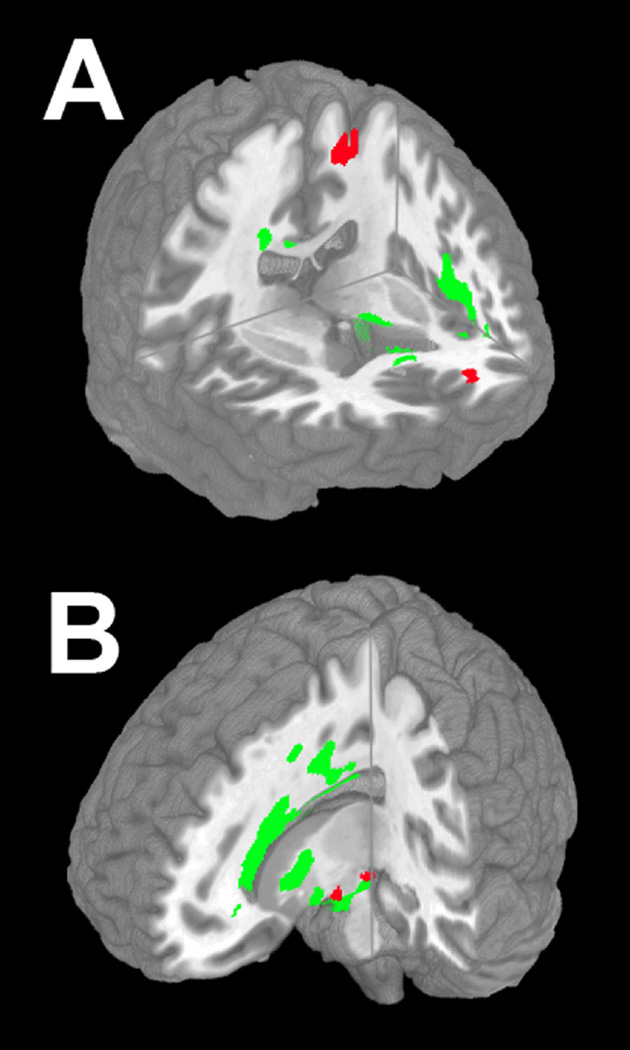
FIGURE 3.
REDUCED WHITE MATTER FRACTIONAL ANISOTROPY IN AMYOTROPHIC LATERAL SCLEROSIS AND 4R-TAU, AND REGRESSIONS RELATING ADJUSTED CSF PTAU:TTAU RATIO TO FRACTIONAL ANISOTROPY. NOTE. Panel A: Right anterior view of anatomic distribution of reduced fractional anisotropy in ALS (q<0.05, FDR-corrected; green). Red areas indicate anatomic distribution of regressions relating adjusted ptau:ttau ratio to fractional anisotropy in corticospinal tract, prefrontal centrum semiovale, and body of corpus callosum (not illustrated). Panel B: Left anterior view of anatomic distribution of reduced fractional anisotropy in 4R-tau (q<0.005, FDR-corrected; green). Red areas indicate anatomic distribution of regressions relating adjusted ptau:ttau ratio to fractional anisotropy in midbrain, right uncinate (not illustrated).

