Figure 5.
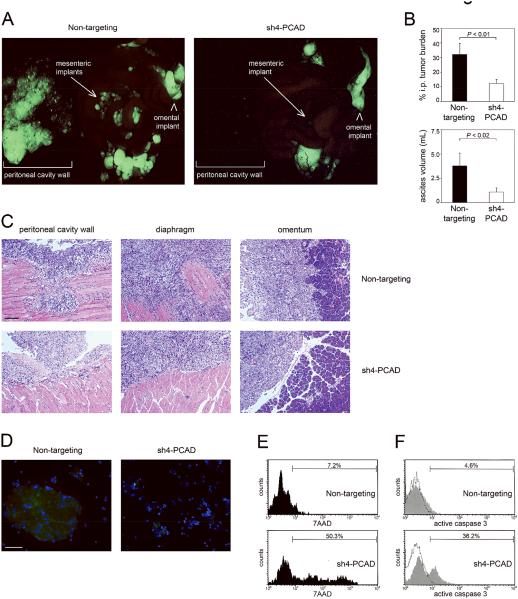
Knockdown of P-cadherin prevents EOC progression in i.p. xenograft models. Female nude mice were inoculated i.p. with equivalent numbers of GFP-expressing control and sh-PCAD SKOV3ip cells and were sacrificed at 3 weeks thereafter (n=5 mice per group). (A) Tumor implants were viewed under a fluorescence stereoscope. (B) I.p. tumor burden was quantified by measuring areas of fluorescence signals in captured images and is expressed as the average percent of area of fluorescence within the abdominal cavity. Fluorescence signals on the peritoneal cavity wall were excluded from analysis. Also shown are volumes of ascites in mice. (C) Representative examples of HE-stained tumor implants on the peritoneal cavity wall and diaphragm. Also shown are omental implants and the adjacent pancreas. Bar, 100 μm. (D) Cells were collected from ascites, stained with Hoechst dye to visualize nuclei (blue) and viewed under immunofluorescence microscopy. GFP-expressing ascitic tumor cells were visualized using a fluorescein filter. Bar, 50 μm. (E,F) Evaluation of cell death within the gated population of GFP+ tumor cells in ascites by flow cytometric analysis of (E) 7AAD staining and (F) staining of active caspase-3.

