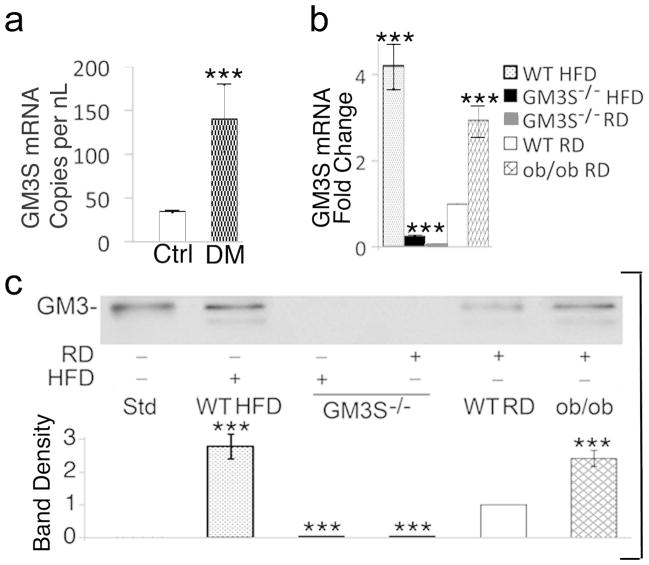
Figure 1. GM3 synthase and GM3 are increased in human and mouse diabetic skin.
(a) Digital droplet PCR to measure GM3S expression in mRNA extracted from non-wounded human plantar skin (n=6 type 2 diabetics (DM) and n=5 age- and site-matched controls); mRNA is measures as copies per nL of PCR product. ***p<0.001; (b, c) Back skin was excised from DIO WT (HFD for 10 wks), ob/ob, GM3S−/− (HFD; RD) and WT (RD) mice (n=5 in each group) for mRNA and glycosphingolipid extraction. qRT-PCR analysis (b) shows three runs in triplicate. Thin layer chromatography immunostaining with anti-GM3 antibody (c) is representative of 5 runs, shown densitometrically (Std = GM3 standard). Results are expressed as mean ± S.D. ***p<0.001, mouse DIO WT and ob/ob vs. WT RD or GM3S−/−; GM3S−/− mice vs. WT RD controls.

