
Figure 3.
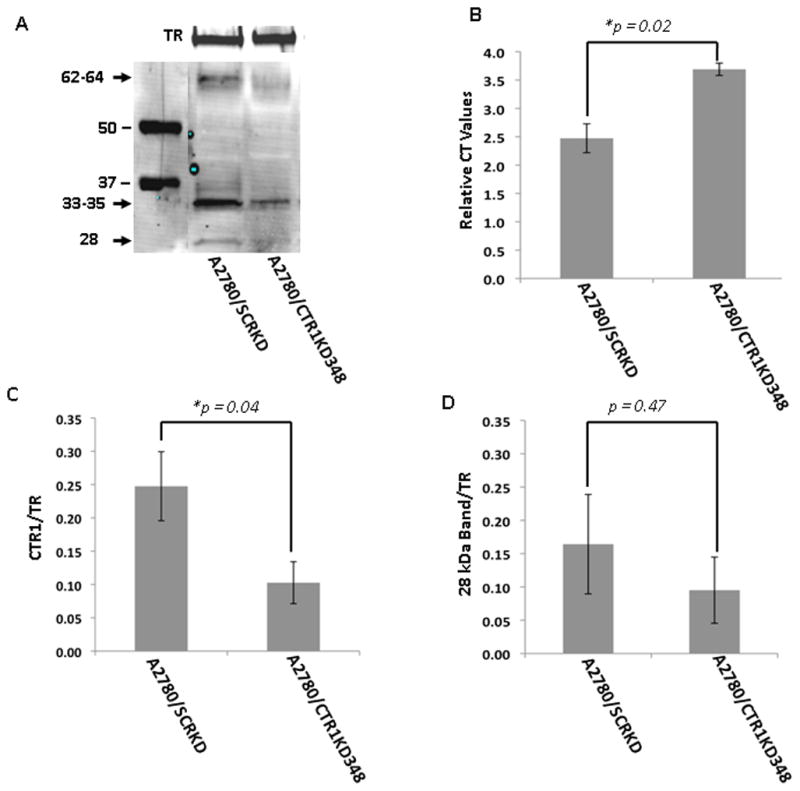
Detection of hCTR1 in A2780 cells molecularly engineered to knockdown hCTR1 expression. A) representative Western blot; B) a histogram showing the mean relative mRNA expression level determined from independent qRT-PCR measurements; C) histogram summarizing the results of 4 independent Western blots. Analyzes were performed on PNM preparations using the Epitomics anti-hCTR1 antibody. Blots were concurrently probed with anti-transferrin receptor (TR) antibody to provide a lane-loading control.