
Figura 4.
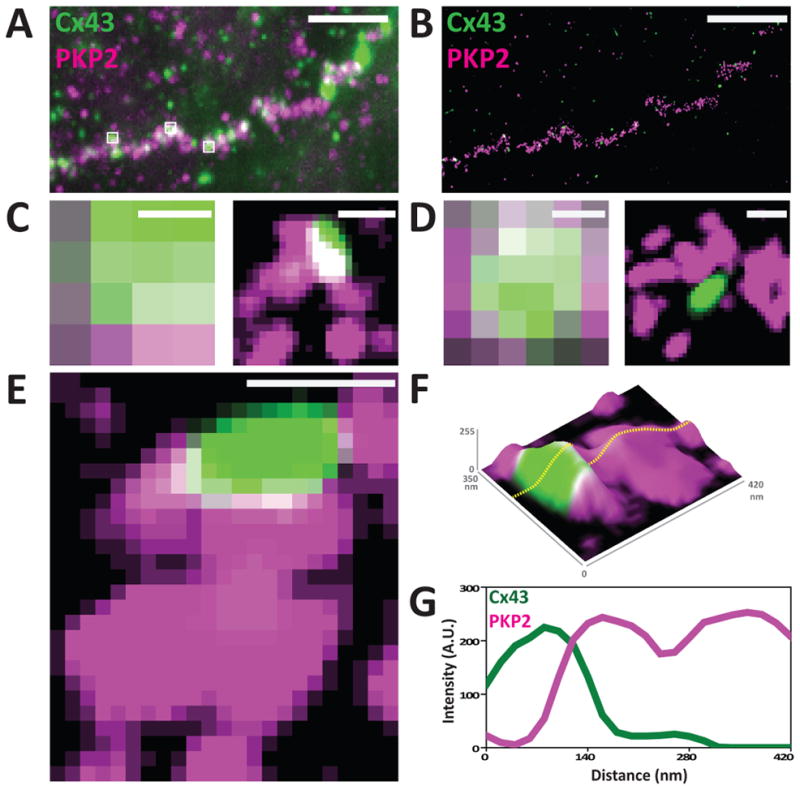
Super-resolution fluorescence microscopy: NRVMs stained for Cx43 (green) and PKP2 (magenta). Panels A and B show the same region visualized by TIRF (A) or by SRFM (B). Enlargement of the small white squares show improved resolution after reconstruction (C-E). Panel E shows a Cx43 cluster surrounded by PKP2. Same image is shown as a topological image in F (z-axis: signal intensity). Intensity plot of the dotted line across the image (G) shows the intersection of both signals. Scale bars: 5μm (A and B) and 200nm (C–E). Reproduced from21 with permission.