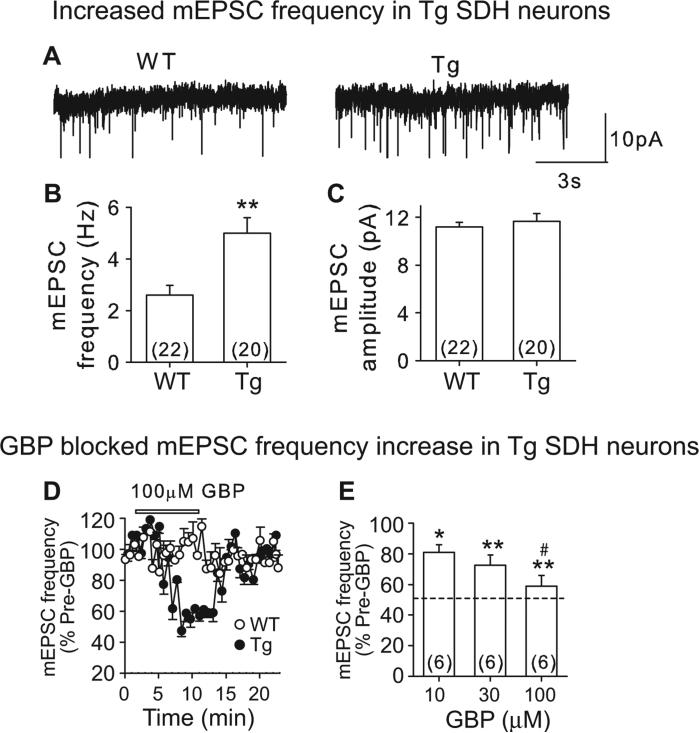
Figure 4. Enhanced mEPSC in SDH neurons from α2δ1 Tg mice.
A. Representative mEPSC traces from WT (left) and α2δ1 Tg (right) SDH neurons. B and C. Summary of averaged mEPSC frequency (B) and amplitude (C) data. **p < 0.01 compared with WT group by Student's t-test. D. Time courses for the effects of 100 μM GBP on mEPSC frequency from WT and Tg L4 SDH neurons. E. Dose-dependent normalization of mEPSC frequency in Tg SDH neurons by GBP. Dot-line represents baseline mEPSC frequency level in WT SDH neurons shown in B. Summarized data are shown as the means ± SEM from the number of neurons indicated in the parentheses. *p < 0.05, **p < 0.01 compared with pre-GBP treatment, #p < 0.05 compared with 10 μM GBP, by one-way ANOVA test.

