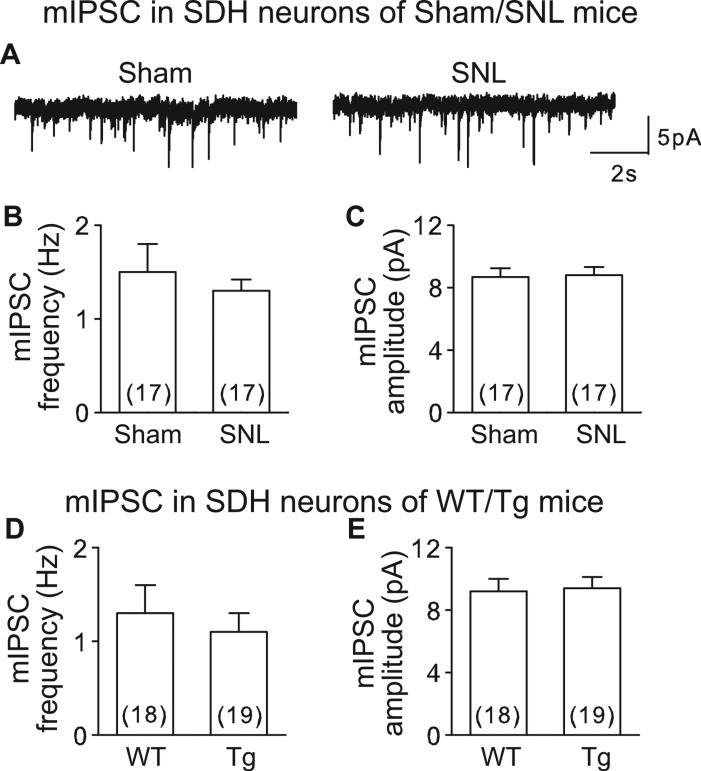
Figure 5. mIPSC was not altered in SDH neurons from SNL and α2δ1 Tg mice.
A. Representative mIPSC traces from a sham (left) or SNL (right) SDH neuron. B-E. Summary of averaged mIPSC frequency (B, D) and amplitude (C, E) from sham/SNL (B, C) or WT/Tg (D, E) mice. Summarized data are shown as the means ± SEM from the number of neurons indicated in the parentheses. p > 0.05 by Student's t-test for all the comparisons between sham and SNL as well as WT and Tg mice.

