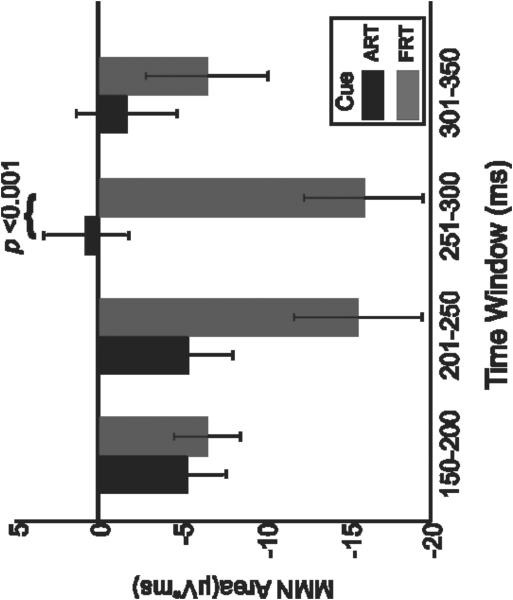
Figure 3.
Bar graph showing MMN response areas (calculated as “area under the curve” for the difference waveform, deviant minus standard) for the cue contrasts, ART versus FRT, and the 50-ms time windows from 150 to 350 ms. Black bars represent response to ART contrast; gray bars represent response to FRT contrast (error bars represent standard error). Negative labels on y-axis for areas signify that MMN is a negative response. MMN: mismatch negativity

