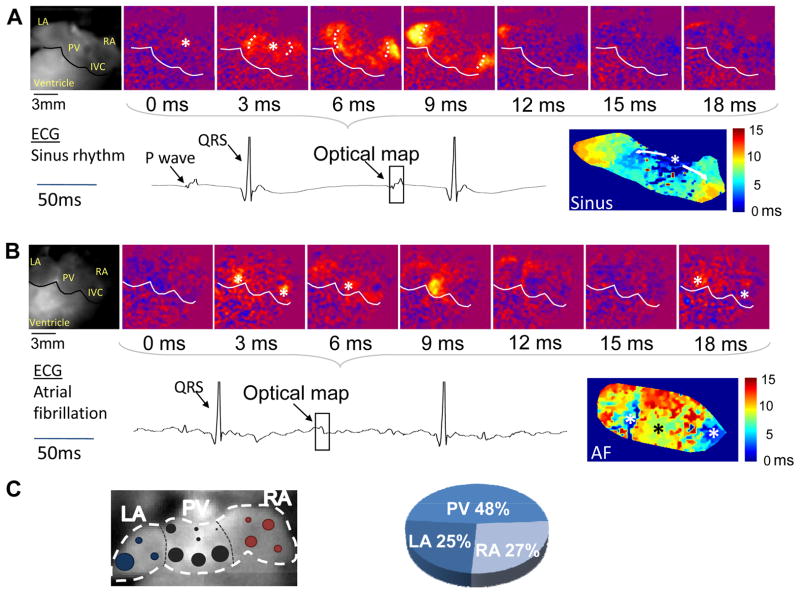
Figure 2.
Representative optical voltage maps of Casq2−/− atria during sinus rhythm (A) and AF (B). Voltage maps were recorded from the posterior aspect of the heart. Asterisks indicate points of earliest activation. The corresponding bright-field image is in the leftmost panels. LA left atrium, RA right atrium, PV pulmonary veins, IVC inferior vena cava. The square in the ECG record indicates time of optical maps. Bottom right panels: Composite activation maps. Note that during sinus rhythm (A), only a single focal activation originates in the posterior aspect of the right atrium close to the crista terminalis where the sinoatrial node is located. Depolarization wavefronts spread towards the right appendage and the left atrium travelling across the posterior atrial walls. During AF (B), three independent depolarizations appear quasi simultaneously (two from the PV region, one near the IVC). Activation wavefronts spread only to a limited area surrounding the respective foci, followed by electrical silence (panel 15 ms), and repetitive activation from the same foci (panel 18 ms).The AF activation map (lower right panel) shows near-simultaneous activation originating from anatomically-distinct foci. C) Anatomical origin of atrial activation during AF. Left panel: Summary of atrial activation sites during AF episodes in 7 Casq2−/− hearts. Size of the circles is proportional to number of events arising from that specific area. Right panel: Distribution of atrial activation sites by region: right atrium (RA), pulmonary vein region (PV) and left atrial appendage (LA).

