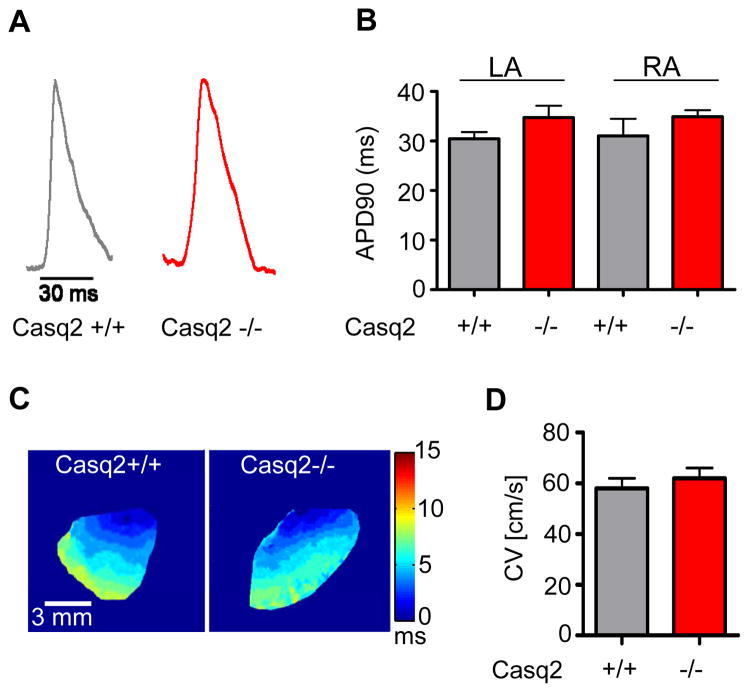
Figure 4.
Action potential duration (APD) and conduction velocity (CV) of Casq2+/+ and Casq2−/− atria. A) Representative example of action potentials recorded optically from the RA appendage in Casq2+/+ and Casq2−/− hearts. B) Average APD at 90% repolarization (ADP90) measured during constant pacing at 100 ms pacing cycle length was not statistically different. C) Optical activation maps of the right atrial appendage during pacing. CV was calculated by defining isochrones where the time of maximum upstroke velocity of the fluorescent signal was the same. D) Average CV values were not statistically different between Casq2+/+ and Casq2−/− atria. N=4–5 hearts per group.

