Figure 6.
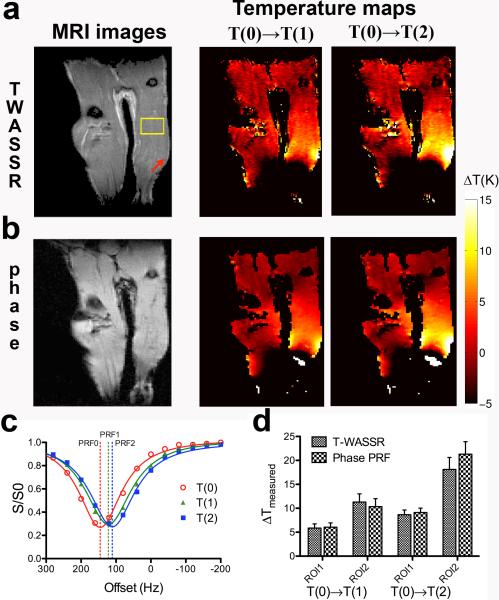
In vivo temperature mapping of hyperthermia using the T-WASSR method. a) A RARE T2w image (left) and temperature maps measured using T-WASSR (right) , 30 minutes after the temperature of circulating water was set to 318K (45°C, T1) and 328K (55°C, T2), respectively. b) A FLASH T1w image and the corresponding temperature maps measured using phase PRF method. c) The WASSR spectra of a muscle ROI of the right leg of a mouse (yellow box in the T2-w image in a) before heating (T(0), red) and after heating to temperature T(1) (green) and temperature T(2) (blue). Solid lines show the Lorentzian fitting; dashed lines show the fitted water PRF for each temperature. d) Quantitative comparison of the measured temperature changes using two methods. ROI 1 is the same ROI used in c) and ROI 2 is a small region indicated by the red arrow on the T2-w image, where a very high temperature increase was observed.

