Figure 5.
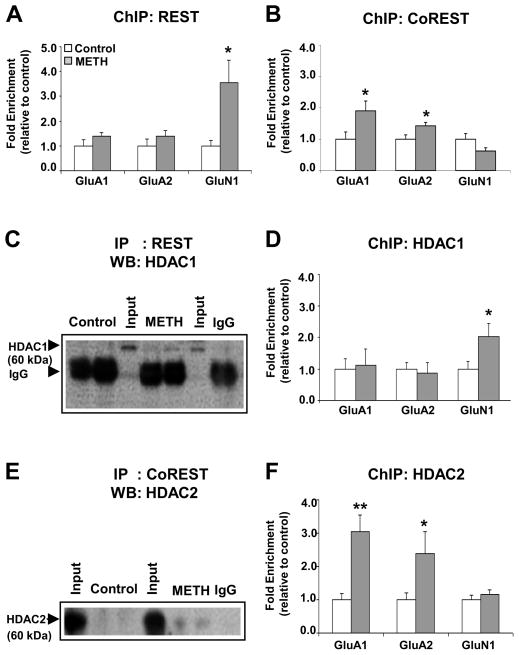
Chronic METH increases enrichment of CoREST on GluA1 and GluA2 gene promoters whereas enrichment of REST was observed on GluN1 promoter. ChIP assays (n=8 rats per group) were performed on striata of control and METH-treated rats with (A) anti-REST and (B) anti-CoREST antibodies. Quantitative PCR was conducted as described in the text using specific ChIP primers directed at GluA1 or GluA2 or GluN1 promoter (see Table S2). Values represent means ± SEM of fold changes relative to the controls. Statistical significance was determined by un-paired Student’s t-test. Key to statistics: * p< 0.05; ** p< 0.01; *** p< 0.001 vs. control group. Co-immunoprecipitation assays of (C) REST and HDAC1, and (E) CoREST and HDAC2. Immunoprecipitates were prepared from striatal nuclear extracts of control and METH-treated rats using antibody against anti-REST, anti-CoREST, and recovery of HDAC1 and HDAC2 was determined by western blot assay. The levels of HDAC1 and HDAC2 from non-specific IgG are indicated. Input levels (5 %) of HDAC1 and HDAC2 are shown for comparison. ChIP assays (n=6 - 8 rats per group) were carried out using antibodies against HDAC1 (D), and HDAC2 (F) on GluA1, GluA2 and GluN1 DNA sequences. Quantitative PCR was conducted as described in the text using specific ChIP primers directed at GluA1, GluA2 or GluN1 promoters (see Table S2). Values represent means ± SEM of fold changes relative to the controls. Statistical significance was determined by un-paired Student’s t-test. Key to statistics: * p< 0.05; ** p< 0.01; *** p< 0.001 vs. control group.

