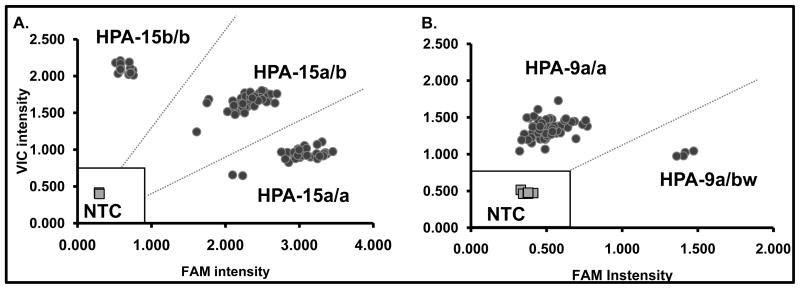
Figure 1. TaqMan OpenArray Genotyping analysis.
Typical HPA-15 and HPA-9 results shown for 45 fathers of unresolved NAIT cases. Signal intensities of Vic versus Fam fluorophores (normalized to internal Rox signal) are plotted. Each individual is genotyped in duplicate. No template controls (NTC) are denoted by grey squares (four individual reactions throughout the array). The no call region (marked with open square) is defined as the average signal of NTCs + 3SD. A. HPA-15 genotypic analysis (black circles): The Vic fluorophore reports the HPA-15b and FAM reports HPA-15a allele. HPA-15a and -15b alleles have an allelic frequency of 0.455 and 0.545 respectively resulting in three genotypic populations corresponding to HPA-15a/a, -15a/b and -15b/b. B. HPA-9 genotypic analysis (black circles): Vic reports the HPA-9a allele and FAM reports HPA-9bw. Two populations are seen rather than three because the allelic frequency of HPA-9bw is 0.002 and an HPA-9bw/bw individual has never been encountered.

