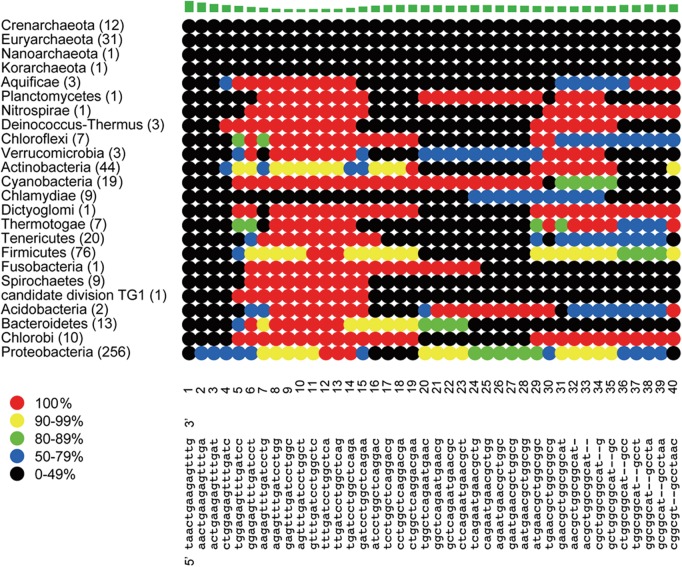
Figure 1.
A partial plot of the consensus sequence in each window and its coverage rate for each phylum from 531 16S rRNA genes of genome-sequenced strains. The number of species in each phylum is indicated in parentheses. The start position of each window is represented according to the corresponding position in the 16S rRNA gene from Escherichia coli. The consensus sequence in each window is represented at the bottom of the figure. Each line indicate the coverage rate for the consensus sequence of each phylum by using the colours of dots: black <50%, blue <80%, green <90%, yellow <100%, and red = 100%. The bar graph at the top of the figure indicates the sequence variability of each window that is depicted by (i) calculating the relative entropy of four nucleotides and the gap (−) at each site38 and (ii) summing up the relative entropy of each site in the window.

