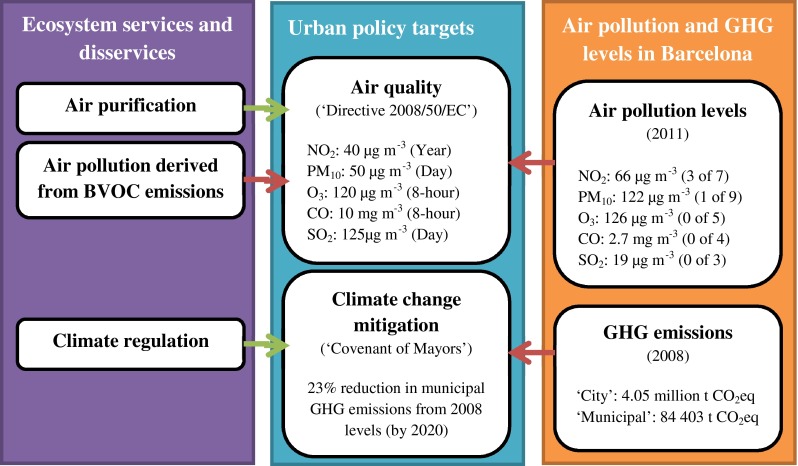
Fig. 2.

Framework for assessing links between ecosystem services and disservices, urban policy targets, and air pollution and GHG levels in Barcelona. Notes: air quality policy limits correspond to the most stringent EU values set for the protection of human health (in brackets the averaging period applicable for each limit). Some limits are subject to a specific number of allowed exceedances (e.g., PM10 limit can be exceeded 35 days per year at the most). See EEA (2013) for more details. Air pollution levels in Barcelona show the highest concentration values among all the monitoring stations measuring the corresponding air pollutant during the year 2011 (in brackets the number of monitoring stations exceeding the air quality limit after considering the number of allowed exceedances). See ASPB air quality report (2011) for more details. Arrows represent the links between ecosystem services and disservices, air pollution and GHG levels and urban policy targets in Barcelona (red arrows represent a negative impact towards policy targets and green arrows a positive impact). Sources: Own elaboration based on EEA (2013), ASPB air quality report (2011) and PECQ (2011)
