
Figure 1. Smoothed distribution of bovine tuberculosis and Fasciola hepatica.
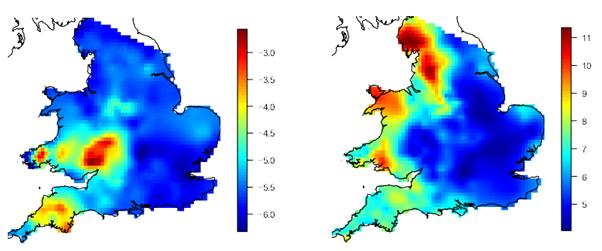
(a) Smoothed log-odds of an individual dairy animal having been detected as BTB-positive in 2004-2007. Bovine tuberculosis data for 3026 farms also tested for exposure to F. hepatica, were obtained from the UK Department for Environment, Food and Rural Affairs (DEFRA) VETNET database. A data cleaning process was undertaken to ensure only records pertaining to actual livestock tests were analysed; (b) Smoothed square root of the percent positive (PP) value for F. hepatica. To determine the prevalence of exposure to F. hepatica, bulk milk samples were obtained from the same 3026 dairy farms in England and Wales and tested using an antibody detection ELISA. Samples were obtained from three major milk testing companies in England and Wales between November 2006 and January 2007