
Figure 3. Empirical variograms for incidence of BTB, F. hepatica infection and the residuals from the fitted model.
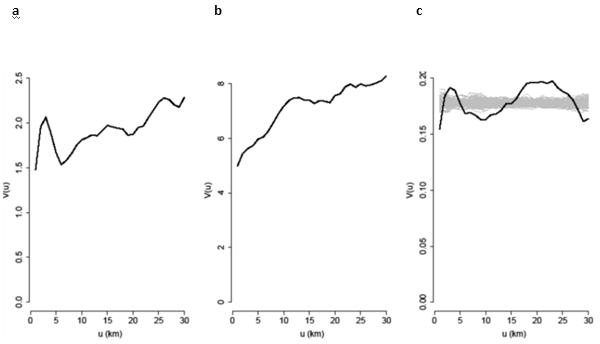
(a) Log-odds of the herd-level cumulative incidence of BTB ; (b) square-root of the pp-value ; (c) the residuals from the fitted model; the grey lines are empirical variograms computed from 99 independent permutations of the residuals over the locations. These provide an informal tolerance envelope for the empirical variogram when the residuals are spatially independent. A formal Monte Carlo test rejects the spatial independence hypothesis (p=0.01) but the absence of a clear rising trend in the empirical variogram, in contrast to the behaviour of the other two variograms, suggests that the residual spatial correlation is relatively weak. The x axis, u, denotes distance in kilometres; the y axis, V(u), denotes the estimated value of the variogram at distance u.